. 2010 Feb 15;70(4):1505-12.
doi: 10.1158/0008-5472.CAN-09-1640. Epub 2010 Feb 9.

Tumor detection by imaging proteolytic activity

Affiliations

Tumor detection by imaging proteolytic activity

Molly R Darragh et al. Cancer Res. .

Abstract

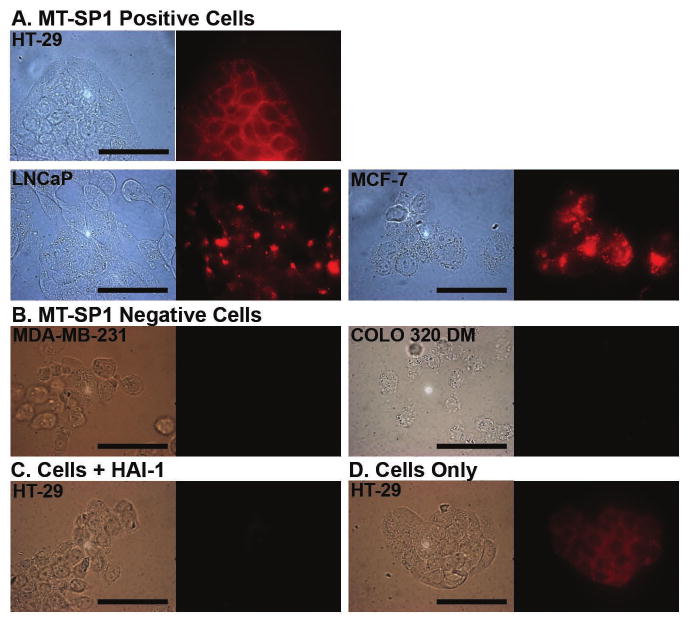
The cell surface protease membrane-type serine protease-1 (MT-SP1), also known as matriptase, is often upregulated in epithelial cancers. We hypothesized that dysregulation of MT-SP1 with regard to its cognate inhibitor hepatocyte growth factor activator inhibitor-1 (HAI-1), a situation that increases proteolytic activity, might be exploited for imaging purposes to differentiate malignant from normal tissue. In this study, we show that MT-SP1 is active on cancer cells and that its activity may be targeted in vivo for tumor detection. A proteolytic activity assay with several MT-SP1-positive human cancer cell lines showed that MT-SP1 antibodies that inhibit recombinant enzyme activity in vitro also bind and inhibit the full-length enzyme expressed on cells. In contrast, in the same assay, MT-SP1-negative cancer cell lines were inactive. Fluorescence microscopy confirmed the cell surface localization of labeled antibodies bound to MT-SP1-positive cells. To evaluate in vivo targeting capability, 0.7 to 2 nmoles of fluorescently labeled antibodies were administered to mice bearing tumors that were positive or negative for MT-SP1. Antibodies localized to MT-SP1-positive tumors (n = 3), permitting visualization of MT-SP1 activity, whereas MT-SP1-negative tumors (n = 2) were not visualized. Our findings define MT-SP1 activity as a useful biomarker to visualize epithelial cancers using a noninvasive antibody-based method.


Conflict of interest statement

The authors declare no competing commercial interest with the work presented here.

Figures

Figure 1
Figure 1
Antibodies are specific for active MT-SP1. SPR binding curves of MT-SP1 (black) and the catalytically inactive mutant R15A (gray) to the A11 Fab show robust binding to active enzyme and a lack of binding to the zymogen, indicating that the inhibitor is specific for the active form of the enzyme. Binding assays with enzyme concentrations up to 1 μM showed similar results (not shown).
Figure 2
Figure 2
MT-SP1-specific inhibitors reduce cell-associated proteolysis of a fluorescent P1-arginine protease substrate. Spectrofluor-tPA was added to seven human cancer cell lines with and without α-MT-SP1 Fab. Because the inhibitors are specific, any reduction in proteolysis can be attributed to an inhibition of active MT-SP1. Black bars represent total P1-Arg proteolytic activity of uninhibited cells, while the grey bars show the activity of cells incubated with α-MT-SP1 Fab. Those cell lines which express MT-SP1 mRNA – MDA-MB-468, MCF-7, HT29 and LNCaP - do show a reduction in proteolysis upon the addition of antibody inhibitor, while the MT-SP1-negative cell lines MDA-MB-231, HT1080, and COLO 320 DM do not.
Figure 3
Figure 3
Fluorescently-labeled α-MT-SP1 scFv localizes to MT-SP1-positive cells in cell culture. (a) HT-29, LNCaP and MCF-7 cells express MT-SP1 mRNA while MDA-MD-231 and COLO 320DM cells (b) do not. Antibodies do not significantly displace HAI-1. HT-29 cells which have been incubated with recombinant HAI-1 (c) show much less surface labeling upon exposure to fluorescently labeled scFv than those which have not been blocked (d). Scale bar = 50 μm. Images were corrected as described in supplemental materials.
Figure 4
Figure 4
α-MT-SP1 antibodies are able to selectively target MT-SP1-positive tumors in vivo. AlexaFluor 680-labeled A11 IgG was injected and imaged using a 2-D fluorescent imager. Tumors are indicated by arrows. In MCF-7/Luc+ xenograft mice, the tumors become selectively labeled with minimal background after 50 hours (a). In the MDA-MB-231/Luc+ (MT-SP1-negative) models, however, no tumor labeling was seen over the same time period (b). As an alternate method for detecting the tumors, mice were injected with approximately 2 mg of luciferin and imaged after 10-15 minutes. Because the Luc+ cells have been engineered to express luciferase, a bioluminescent signal is seen at the tumor, confirming location and viability of the xenograft.

References

    1. Kelloff GJ, Krohn KA, Larson SM, Weissleder R, Mankoff DA, Hoffman JM, et al. The progress and promise of molecular imaging probes in oncologic drug development. Clin Cancer Res. 2005;11(22):7967–85. - PubMed
    1. Mignatti P, Rifkin DB. Biology and biochemistry of proteinases in tumor invasion. Physiol Rev. 1993;73(1):161–95. - PubMed
    1. Andreasen PA, Egelund R, Petersen HH. The plasminogen activation system in tumor growth, invasion, and metastasis. Cell Mol Life Sci. 2000;57(1):25–40. - PMC - PubMed
    1. Egeblad M, Werb Z. New functions for the matrix metalloproteinases in cancer progression. Nat Rev Cancer. 2002;2(3):161–74. - PubMed
    1. Jedeszko C, Sloane BF. Cysteine cathepsins in human cancer. Biol Chem. 2004;385(11):1017–27. - PubMed

Publication types

MeSH terms