. 2010 Apr 9;285(15):11526-36.
doi: 10.1074/jbc.M110.100727. Epub 2010 Feb 9.

Phosphorylation of yeast phosphatidylserine synthase by protein kinase A: identification of Ser46 and Ser47 as major sites of phosphorylation

Affiliations

Phosphorylation of yeast phosphatidylserine synthase by protein kinase A: identification of Ser46 and Ser47 as major sites of phosphorylation

Hyeon-Son Choi et al. J Biol Chem. .

Abstract

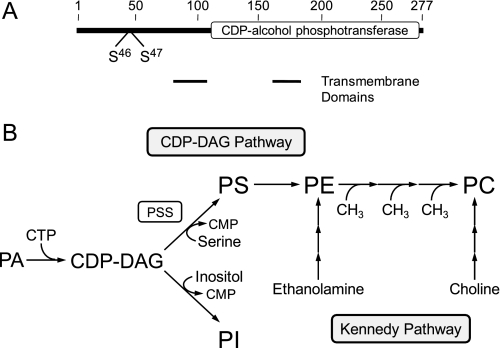
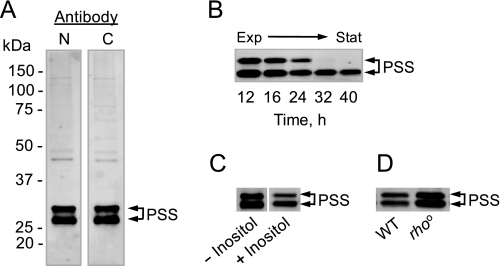
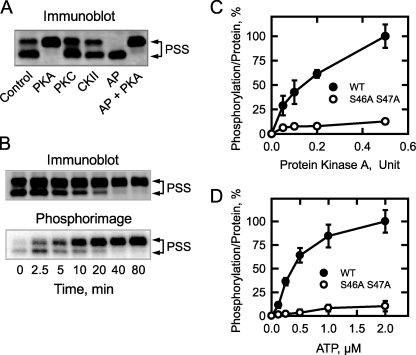
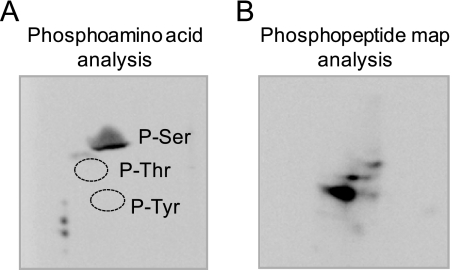
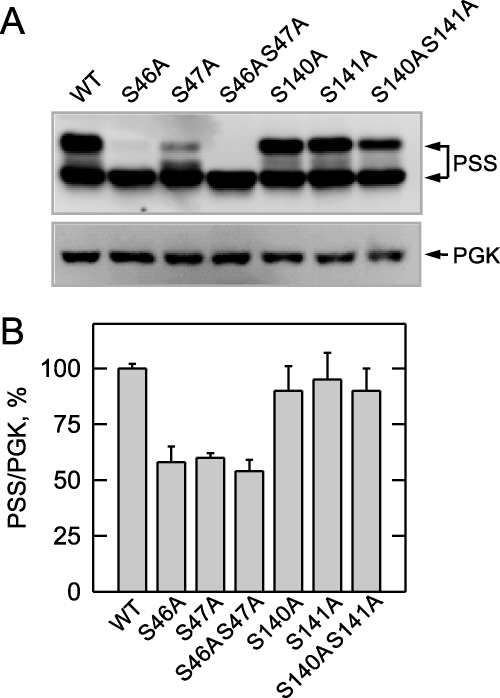
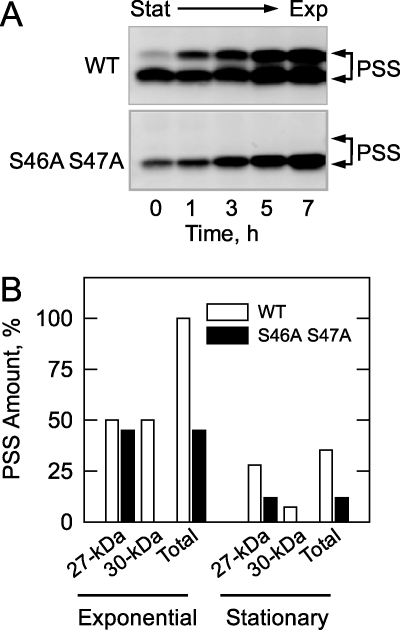
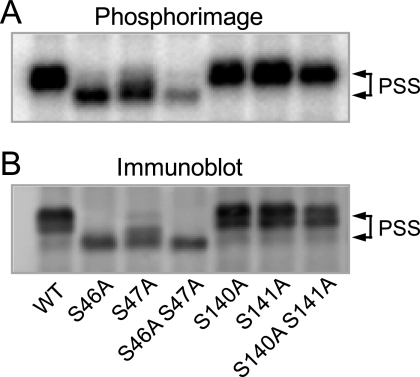
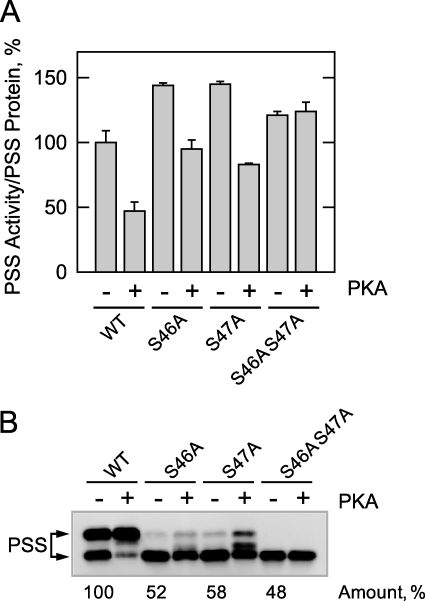
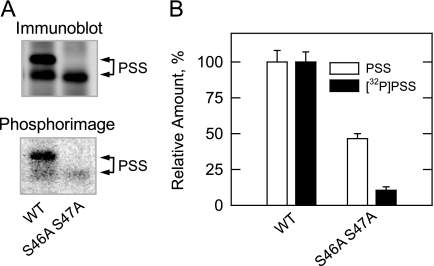
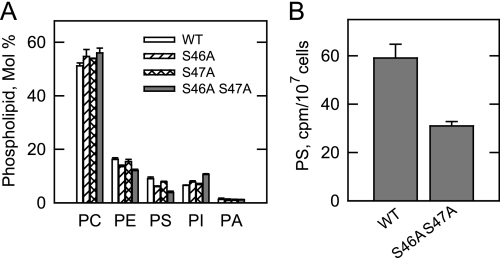
The CHO1-encoded phosphatidylserine synthase from Saccharomyces cerevisiae is phosphorylated and inhibited by protein kinase A in vitro. CHO1 alleles bearing Ser(46) --> Ala and/or Ser(47) --> Ala mutations were constructed and expressed in a cho1Delta mutant lacking phosphatidylserine synthase. In vitro, the S46A/S47A mutation reduced the total amount of phosphorylation by 90% and abolished the inhibitory effect protein kinase A had on phosphatidylserine synthase activity. The enzyme phosphorylation by protein kinase A, which was time- and dose-dependent and dependent on the concentration of ATP, caused a electrophoretic mobility shift from a 27-kDa form to a 30-kDa form. The two electrophoretic forms of phosphatidylserine synthase were present in exponential phase cells, whereas only the 27-kDa form was present in stationary phase cells. In vivo labeling with (32)P(i) and immune complex analysis showed that the 30-kDa form was predominantly phosphorylated when compared with the 27-kDa form. However, the S46A/S47A mutations abolished the protein kinase A-mediated electrophoretic mobility shift. The S46A/S47A mutations also caused a 55% reduction in the total amount of phosphatidylserine synthase in exponential phase cells and a 66% reduction in the amount of enzyme in stationary phase cells. In phospholipid composition analysis, cells expressing the S46A/S47A mutant enzyme exhibited a 57% decrease in phosphatidylserine and a 40% increase in phosphatidylinositol. These results indicate that phosphatidylserine synthase is phosphorylated on Ser(46) and Ser(47) by protein kinase A, which results in a higher amount of enzyme for the net effect of stimulating the synthesis of phosphatidylserine.


Figures

FIGURE 1.
FIGURE 1.
Domain structure of PS synthase and pathways for the synthesis of the major phospholipids in S. cerevisiae. A, the diagram shows the positions of the CDP-alcohol phosphotransferase domain, the transmembrane-spanning domains, and the target sites of protein kinase A phosphorylation. B, the pathways shown for the synthesis of the major phospholipids include the relevant steps discussed in this work. The reaction catalyzed by PS synthase (PSS) is indicated in the figure. A more comprehensive figure that shows the individual steps in the CDP-DAG and Kennedy pathways may be found in Ref. .
FIGURE 2.
FIGURE 2.
PS synthase exists in two forms that differ in electrophoretic mobility. Cell extracts were prepared from wild type cells grown to the exponential (A) and stationary (B) phases of growth, from exponential phase wild type cells grown without and with 50 μm inositol (C), and from exponential phase wild type (WT) and rhoo mutant cells (D). For the experiment shown in B, cells were harvested at the indicated time points as the culture progressed from the exponential (Exp) to stationary (Stat) phases of growth. Samples (12.5 μg of protein) were subjected to immunoblot analysis using 2 μg/ml anti-PS synthase antibodies raised against the N-terminal (N) portion of the PS synthase (PSS) protein. Antibodies to the C-terminal (C) portion of the protein were also used in the experiment shown in A. The lanes shown in C were not adjacent to each other on the original immunoblot and are positioned side by side for comparison. The immunoblots shown are representative of three independent experiments. The positions of the 30- and 27-kDa PS synthase proteins are indicated.
FIGURE 3.
FIGURE 3.
The phosphorylation of PS synthase by protein kinase A causes an electrophoretic mobility shift of the 27-kDa protein to the 30-kDa protein; the phosphorylation of PS synthase is dependent on time and on the concentrations of protein kinase A and ATP. The cell extract was prepared from exponential phase cho1Δ mutant cells bearing CHO1 on a single copy plasmid. PS synthase (PSS) was immunoprecipitated from the cell extract (0.5 mg) with 10 μg of anti-PS synthase antibodies (N-terminal). A, immunoprecipitated PS synthase was incubated for 40 min with 50 μm ATP and 5 pmol/min protein kinase A (PKA), 50 nmol/min protein kinase C (PKC), 25 pmol/min casein kinase II (CKII), 5 μmol/min alkaline phosphatase (AP), or an alkaline phosphatase-treated sample was incubated with 5 pmol/min protein kinase A (AP + PKA). B, immunoprecipitated PS synthase was incubated for the indicated time intervals with 50 μm [γ-32P]ATP and 1 pmol/min protein kinase A. C, immunoprecipitated wild type (WT) and S46A/S47A mutant PS synthase were incubated for 40 min with 50 μm [γ-32P]ATP and the indicated amounts of protein kinase A. D, immunoprecipitated wild type and S46A S47A mutant PS synthase were incubated for 40 min with 1 pmol/min protein kinase A and the indicated concentrations of [γ-32P]ATP. After the reactions, samples were subjected to immunoblot analysis using anti-PS synthase antibodies (N-terminal). Phosphorimaging analysis was performed on the polyvinylidene difluoride membranes with 32P-labeled PS synthase (B–D). The data shown in A and B are representative of three independent experiments. For C and D, the relative amounts of phosphate incorporated into PS synthase were quantified using ImageQuant software. The maximum extent of PS synthase phosphorylation was set at 100%. The data were normalized to the amount of PS synthase protein as determined by immunoblot analysis. The values reported were the average of three separate experiments ± S.D. The positions of the 30- and 27-kDa PS synthase proteins are indicated.
FIGURE 4.
FIGURE 4.
Phosphoamino acid and phosphopeptide mapping analyses of PS synthase phosphorylated by protein kinase A. The cell extract was prepared from exponential phase cho1Δ mutant cells bearing CHO1 on a single copy plasmid. PS synthase was immunoprecipitated from the cell extract (0.5 mg) with 10 μg of anti-PS synthase antibodies (N-terminal). Immunoprecipitated PS synthase was phosphorylated for 40 min with 50 μm [γ-32P]ATP and 1 pmol/min protein kinase A, followed by SDS-PAGE and transfer to polyvinylidene difluoride membrane. A, a piece of polyvinylidene difluoride membrane containing 32P-labeled PS synthase was hydrolyzed with 6 n HCl for 90 min at 110 °C, and the hydrolysate was separated by two-dimensional electrophoresis. The positions of the standard phosphoamino acids phosphoserine (P-Ser), phosphothreonine (P-Thr), and phosphotyrosine (P-Tyr) are indicated. B, a piece of polyvinylidene difluoride membrane containing 32P-labeled PS synthase was digested with trypsin. The resulting peptides were separated on cellulose thin layer plates by electrophoresis (from left to right) in the first dimension and by chromatography (from bottom to top) in the second dimension. The data shown in the two panels were representative of two independent experiments.
FIGURE 5.
FIGURE 5.
PS synthase protein levels are reduced in cho1Δ cells bearing the S46A and S47A mutations. cho1Δ cells expressing wild type (WT) and the indicated PS synthase (PSS) mutant enzymes were grown to the exponential phase of growth in complete synthetic medium. Cell extracts were prepared and used for immunoblot analysis (12.5 μg of protein samples) using anti-PS synthase and anti-phosphoglycerate kinase (PGK) antibodies (A). The relative amounts of PS synthase (30- plus 27-kDa forms)/phosphoglycerate kinase proteins from wild type and mutant cells were determined by ImageQuant analysis (B). Representative immunoblots of PS synthase and phosphoglycerate kinase are shown in A, whereas the quantitation data shown in B are from three independent experiments ± S.D. The positions of the 30- and 27-kDa PS synthase proteins are indicated.
FIGURE 6.
FIGURE 6.
Effects of the S46A/S47A mutations on the amounts of the PS synthase proteins during growth. A, cultures (200 ml) of cho1Δ cells expressing wild type (WT) and the S46A/S47A mutant PS synthase (PSS) enzymes were grown to the stationary (Stat) phase of growth (32 h) in complete synthetic medium. The cells were harvested by centrifugation, resuspended in 200 ml of fresh growth medium, and allowed to resume growth back into the exponential (Exp) phase. At the indicated time intervals, cells (20 ml) were taken from the cultures, cell extracts were prepared, and samples (25 μg of protein) were subjected to immunoblot analysis using 2 μg/ml anti-PS synthase antibodies (N-terminal). The immunoblot data for the wild type and mutant enzymes are positioned vertically for comparison, and the positions of the 30- and 27-kDa forms of PS synthase are indicated. The immunoblot is representative of two independent experiments. B, the relative amounts of the PS synthase proteins were determined by ImageQuant analysis of the images in A. The amounts of the 27- and 30-kDa forms of the wild type and S46A/S47A mutant proteins were normalized to the total amount of the wild type enzyme (both forms) in the exponential phase of growth (7 h time point). The positions of the 30- and 27-kDa forms of PS synthase are indicated.
FIGURE 7.
FIGURE 7.
The phosphorylation of PS synthase by protein kinase A is reduced by the S46A and S47A mutations. The cell extract was prepared from exponential phase cho1Δ mutant cells expressing wild type (WT) and the indicated PS synthase (PSS) mutant enzymes. PS synthase was immunoprecipitated from the cell extract (0.5 mg) with 10 μg of anti-PS synthase antibodies (N-terminal). The immunoprecipitated PS synthase samples were incubated for 40 min with 50 μm [γ-32P]ATP and 1 pmol/min protein kinase A. After the incubation, the samples were subjected to SDS-PAGE and transferred to polyvinylidene difluoride membrane. The polyvinylidene difluoride membrane was subjected to phosphorimaging (A) and immunoblot analysis using anti-PS synthase antibodies (N-terminal) (B). The data shown are representative of three independent experiments. The positions of the 30- and 27-kDa PS synthase proteins are indicated.
FIGURE 8.
FIGURE 8.
The S46A and S47A mutations abolish the protein kinase A-mediated inhibition of PS synthase activity. The membrane fraction was prepared from exponential phase cho1Δ mutant cells expressing wild type (WT) and the indicated PS synthase (PSS) mutant enzymes. Samples (25 μg of protein) were incubated for 30 min in the phosphorylation reaction mixture containing 50 μm ATP without and with 5 pmol/min protein kinase A (PKA). After the incubation, one half of the sample was used for the measurement of PS synthase activity (A), and the other half of the sample was used for immunoblot analysis with anti-PS synthase antibodies (B). The PS synthase activity was normalized to the relative amount of PS synthase (30- plus 27-kDa forms) that was determined by ImageQuant analysis of the immunoblot. The PS synthase activity data are from three independent experiments ± S.D. A representative immunoblot of the three experiments is shown. The positions of the 30- and 27-kDa PS synthase proteins are indicated.
FIGURE 9.
FIGURE 9.
Effects of the S46A/S47A mutations on the amount and the phosphorylation of the PS synthase in vivo. Cultures (5 ml) of cho1Δ mutant cells expressing wild type (WT) and the S46A/S47A mutant PS synthase (PSS) enzymes were grown to the exponential phase of growth in complete synthetic medium containing 32Pi (100 μCi/ml). Cell extracts were prepared and used for the immunoprecipitation of PS synthase with anti-PS synthase antibodies (N-terminal). A, the immunoprecipitated samples were subjected to immunoblot analysis (top) and phosphorimaging (bottom). B, the relative amounts of the PS synthase proteins and the extent of their phosphorylations were determined by ImageQuant analysis of the images in A. The data shown in A are representative of two independent experiments, whereas the data shown in B are the average of two independent experiments ± S.D. The positions of the 30- and 27-kDa forms of PS synthase are indicated.
FIGURE 10.
FIGURE 10.
Effects of the S46A, S47A, and S46A/S47A mutations in PS synthase on phospholipid composition and on the synthesis of PS. A, cultures (5 ml) of cho1Δ mutant cells expressing wild type (WT) and the indicated PS synthase mutant enzymes were grown to the exponential phase of growth in complete synthetic medium containing 32Pi (5 μCi/ml). B, cells expressing the wild type and the S46A/S47A mutant PS synthase enzymes were grown to the exponential phase and then labeled for 30 min with [14C]serine (10 μCi/ml). Phospholipids were extracted and separated by two-dimensional thin layer chromatography. The TLC plates were subjected to phosphorimaging. For the experiment shown in A, the images were subjected to ImageQuant analysis. The percentages shown for the individual phospholipids were normalized to the total 32P-labeled chloroform-soluble fraction that included minor phospholipids and sphingolipids. For the experiment shown in B, the amount of label in PS was determined by scintillation counting. The data shown in both panels are the average of three experiments ± S.D. PA, phosphatidate.

Similar articles

Cited by

References

    1. Bae-Lee M. S., Carman G. M. (1984) J. Biol. Chem. 259, 10857–10862 - PubMed
    1. Letts V. A., Klig L. S., Bae-Lee M., Carman G. M., Henry S. A. (1983) Proc. Natl. Acad. Sci. U.S.A. 80, 7279–7283 - PMC - PubMed
    1. Nikawa J., Tsukagoshi Y., Kodaki T., Yamashita S. (1987) Eur. J. Biochem. 167, 7–12 - PubMed
    1. Kiyono K., Miura K., Kushima Y., Hikiji T., Fukushima M., Shibuya I., Ohta A. (1987) J. Biochem. 102, 1089–1100 - PubMed
    1. Natter K., Leitner P., Faschinger A., Wolinski H., McCraith S., Fields S., Kohlwein S. D. (2005) Mol. Cell. Proteomics 4, 662–672 - PubMed

Publication types

MeSH terms