

Characterization of the human insulin-induced gene 2 (INSIG2) promoter: the role of Ets-binding motifs
- PMID: 20145255
- PMCID: PMC2852912
- DOI: 10.1074/jbc.M109.067447
Characterization of the human insulin-induced gene 2 (INSIG2) promoter: the role of Ets-binding motifs
Abstract
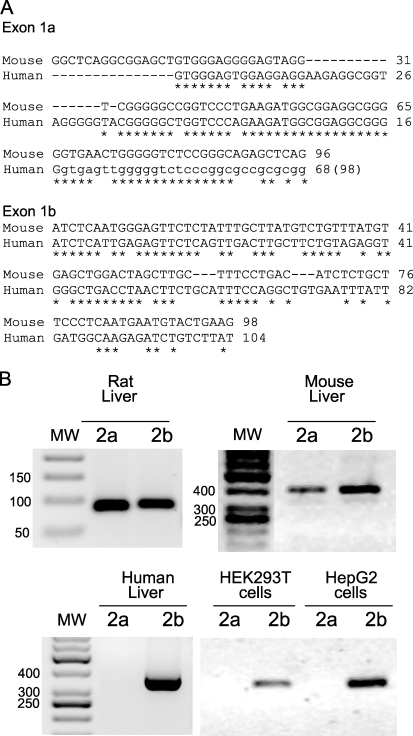
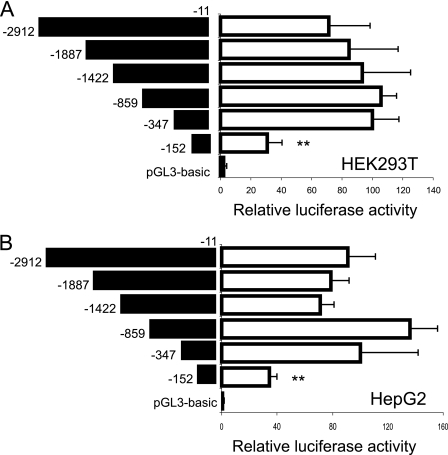
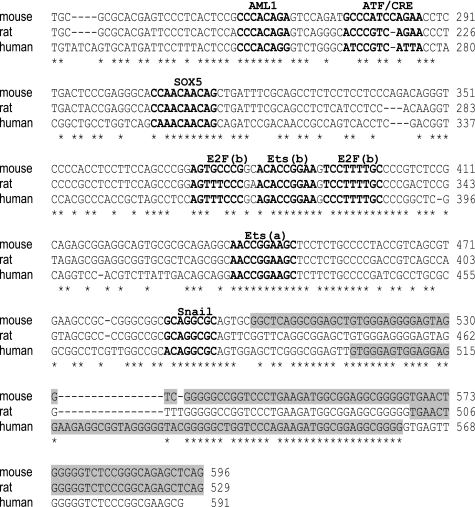
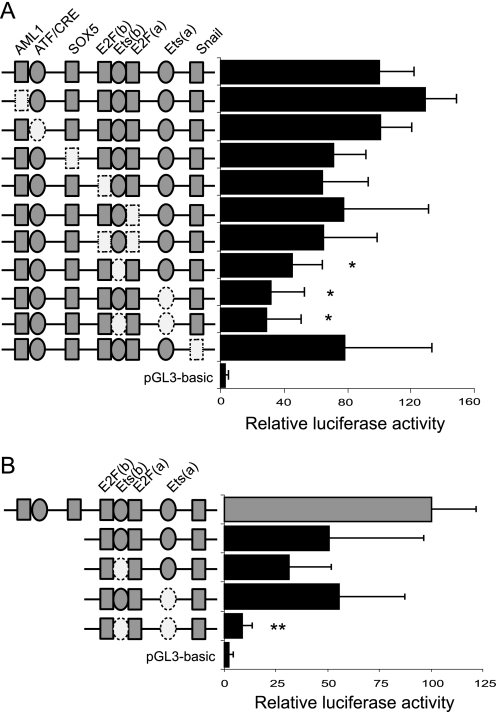
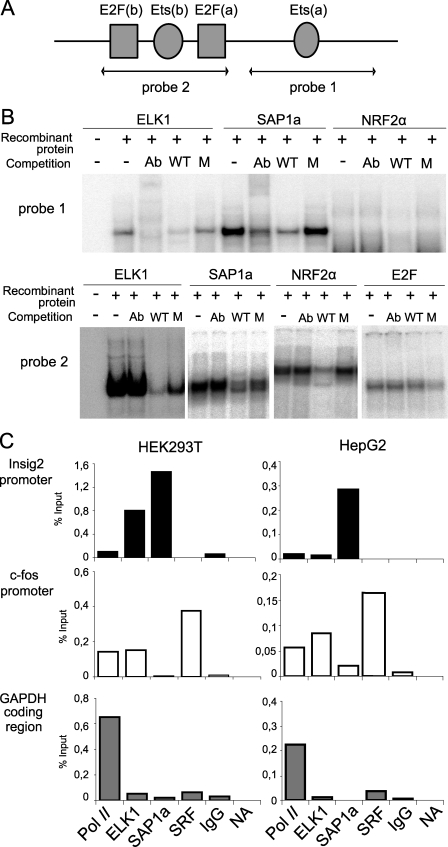
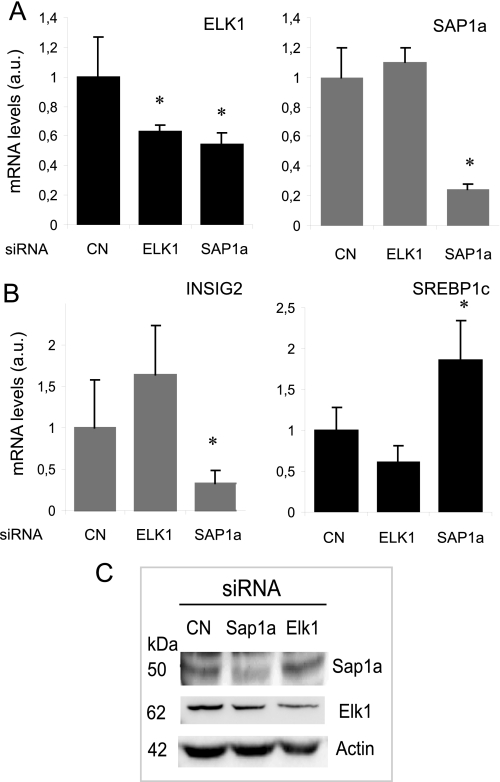
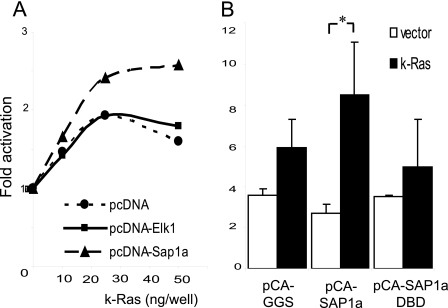
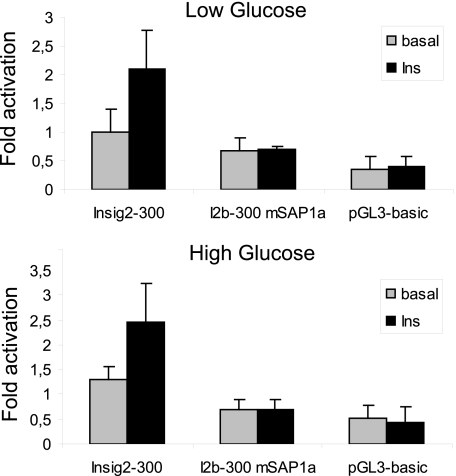
Insulin-induced gene 2 (INSIG2) and its homolog INSIG1 encode closely related endoplasmic reticulum proteins that regulate the proteolytic activation of sterol regulatory element-binding proteins, transcription factors that activate the synthesis of cholesterol and fatty acids in animal cells. Several studies have been carried out to identify INSIG2 genetic variants associated with metabolic diseases. However, few data have been published regarding the regulation of INSIG2 gene expression. Two Insig2 transcripts have been described in rodents through the use of different promoters that produce different noncoding first exons that splice into a common second exon. Herein we report the cloning and characterization of the human INSIG2 promoter and the detection of an INSIG2-specific transcript homologous to the Insig2b mouse variant in human liver. Deletion analyses on 3 kb of 5'-flanking DNA of the human INSIG2 gene revealed the functional importance of a 350-bp region upstream of the transcription start site. Mutated analyses, chromatin immunoprecipitation assays, and RNA interference analyses unveiled the significance of an Ets-consensus motif in the proximal region and the interaction of the Ets family member SAP1a (serum response factor (SRF) accessory protein-1a) with this region of the human INSIG2 promoter. Moreover, our findings suggest that insulin activated the human INSIG2 promoter in a process mediated by phosphorylated SAP1a. Overall, these results map the functional elements in the human INSIG2 promoter sequence and suggest an unexpected regulation of INSIG2 gene expression in human liver.
Figures
Similar articles
-
FLI1 and EWS-FLI1 function as ternary complex factors and ELK1 and SAP1a function as ternary and quaternary complex factors on the Egr1 promoter serum response elements.Oncogene. 1997 Jan 16;14(2):213-21. doi: 10.1038/sj.onc.1200839. Oncogene. 1997. PMID: 9010223
-
Characterization of the 5'-flanking region of the mouse asparagine-linked glycosylation 12 homolog gene.Cell Mol Biol Lett. 2013 Sep;18(3):315-27. doi: 10.2478/s11658-013-0091-2. Epub 2013 Jul 1. Cell Mol Biol Lett. 2013. PMID: 23818223 Free PMC article.
-
Insulin-induced gene 2 involvement in human adipocyte metabolism and body weight regulation.J Clin Endocrinol Metab. 2008 May;93(5):1995-2001. doi: 10.1210/jc.2007-1850. Epub 2008 Mar 4. J Clin Endocrinol Metab. 2008. PMID: 18319320
-
An upstream element containing an ETS binding site is crucial for transcription of the human presenilin-1 gene.J Biol Chem. 1999 Aug 20;274(34):24297-307. doi: 10.1074/jbc.274.34.24297. J Biol Chem. 1999. PMID: 10446206
-
Ets-1/Elk-1 is a critical mediator of dipeptidyl-peptidase III transcription in human glioblastoma cells.FEBS J. 2010 Apr;277(8):1861-75. doi: 10.1111/j.1742-4658.2010.07603.x. Epub 2010 Mar 2. FEBS J. 2010. PMID: 20236318
Cited by
-
Dual functions of Insig proteins in cholesterol homeostasis.Lipids Health Dis. 2012 Dec 18;11:173. doi: 10.1186/1476-511X-11-173. Lipids Health Dis. 2012. PMID: 23249523 Free PMC article. Review.
-
Human SREBP1c expression in liver is directly regulated by peroxisome proliferator-activated receptor alpha (PPARalpha).J Biol Chem. 2011 Jun 17;286(24):21466-77. doi: 10.1074/jbc.M110.209973. Epub 2011 May 2. J Biol Chem. 2011. PMID: 21540177 Free PMC article.
-
Integration of TGF-β-induced Smad signaling in the insulin-induced transcriptional response in endothelial cells.Sci Rep. 2019 Nov 18;9(1):16992. doi: 10.1038/s41598-019-53490-x. Sci Rep. 2019. PMID: 31740700 Free PMC article.
-
Hypoxia-inducible factor 1α activates insulin-induced gene 2 (Insig-2) transcription for degradation of 3-hydroxy-3-methylglutaryl (HMG)-CoA reductase in the liver.J Biol Chem. 2017 Jun 2;292(22):9382-9393. doi: 10.1074/jbc.M117.788562. Epub 2017 Apr 17. J Biol Chem. 2017. PMID: 28416613 Free PMC article.
-
cAMP response element binding protein H mediates fenofibrate-induced suppression of hepatic lipogenesis.Diabetologia. 2013 Feb;56(2):412-22. doi: 10.1007/s00125-012-2771-2. Epub 2012 Nov 13. Diabetologia. 2013. PMID: 23150180
References
-
- Reaven G. M. (1988) Diabetes 37, 1595–1607 - PubMed
-
- Lemieux I., Pascot A., Couillard C., Lamarche B., Tchernof A., Alméras N., Bergeron J., Gaudet D., Tremblay G., Prud'homme D., Nadeau A., Després J. P. (2000) Circulation 102, 179–184 - PubMed
-
- Sewter C., Berger D., Considine R. V., Medina G., Rochford J., Ciaraldi T., Henry R., Dohm L., Flier J. S., O'Rahilly S., Vidal-Puig A. J. (2002) Diabetes 51, 1035–1041 - PubMed
-
- Shimomura I., Matsuda M., Hammer R. E., Bashmakov Y., Brown M. S., Goldstein J. L. (2000) Mol. Cell 6, 77–86 - PubMed
Publication types
MeSH terms
Substances
LinkOut - more resources
Full Text Sources
Molecular Biology Databases
Miscellaneous
