

Glucagon-like peptide-1 increases beta-cell glucose competence and proliferation by translational induction of insulin-like growth factor-1 receptor expression
- PMID: 20145256
- PMCID: PMC2856261
- DOI: 10.1074/jbc.M109.091116
Glucagon-like peptide-1 increases beta-cell glucose competence and proliferation by translational induction of insulin-like growth factor-1 receptor expression
Abstract
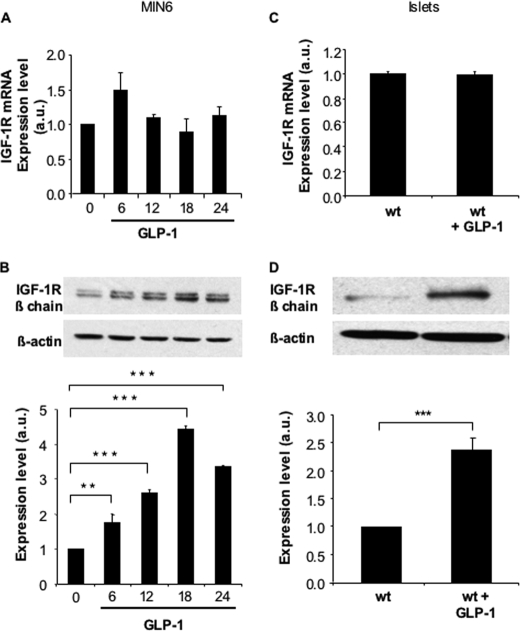
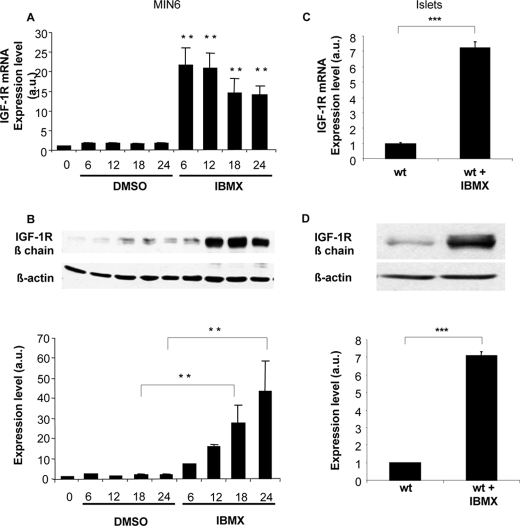
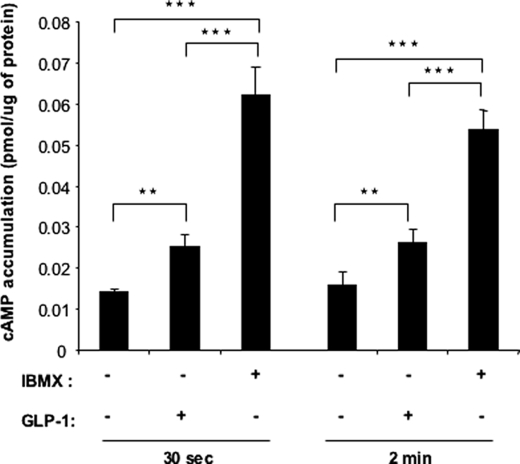
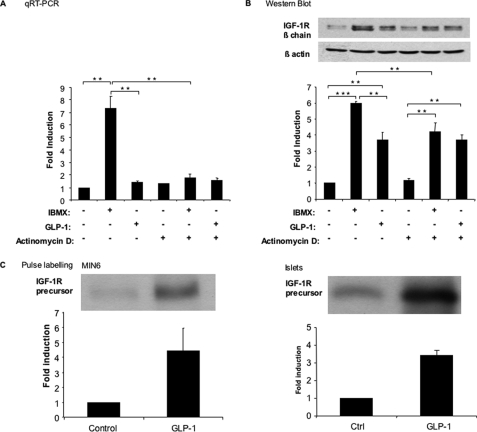
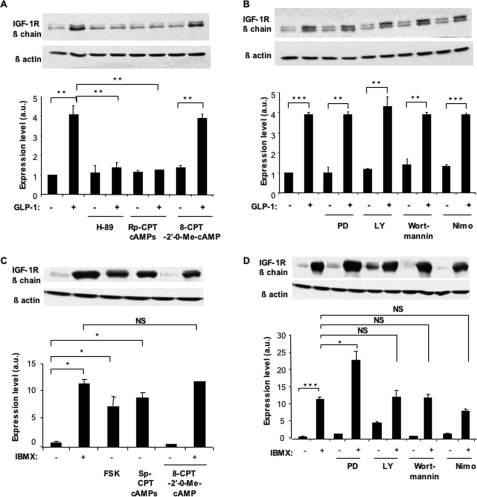
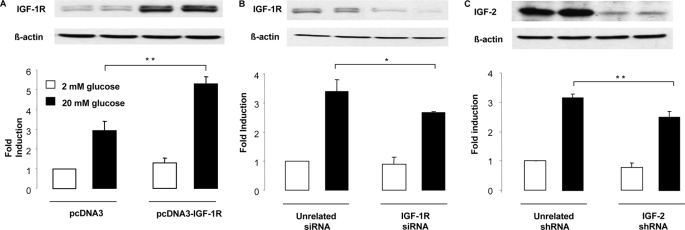
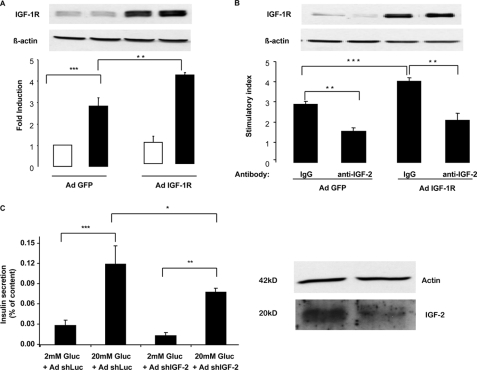
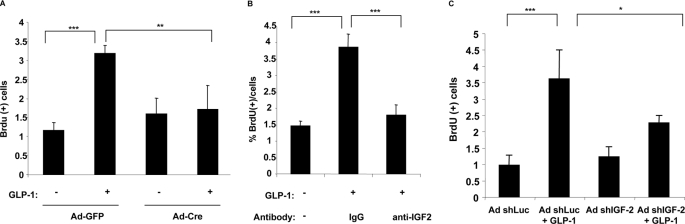
Glucagon-like peptide-1 (GLP-1) protects beta-cells against apoptosis, increases their glucose competence, and induces their proliferation. We previously demonstrated that the anti-apoptotic effect was mediated by an increase in insulin-like growth factor-1 receptor (IGF-1R) expression and signaling, which was dependent on autocrine secretion of insulin-like growth factor 2 (IGF-2). Here, we further investigated how GLP-1 induces IGF-1R expression and whether the IGF-2/IGF-1R autocrine loop is also involved in mediating GLP-1-increase in glucose competence and proliferation. We show that GLP-1 up-regulated IGF-1R expression by a protein kinase A-dependent translational control mechanism, whereas isobutylmethylxanthine, which led to higher intracellular accumulation of cAMP than GLP-1, increased both IGF-1R transcription and translation. We then demonstrated, using MIN6 cells and primary islets, that the glucose competence of these cells was dependent on the level of IGF-1R expression and on IGF-2 secretion. We showed that GLP-1-induced primary beta-cell proliferation was suppressed by Igf-1r gene inactivation and by IGF-2 immunoneutralization or knockdown. Together our data show that regulation of beta-cell number and function by GLP-1 depends on the cAMP/protein kinase A mediated-induction of IGF-1R expression and the increased activity of an IGF-2/IGF-1R autocrine loop.
Figures
Similar articles
-
GLP-1 protects β-cells against apoptosis by enhancing the activity of an IGF-2/IGF1-receptor autocrine loop.Islets. 2009 Nov-Dec;1(3):280-2. doi: 10.4161/isl.1.3.9932. Islets. 2009. PMID: 21099285
-
Glucagon-like peptide-1 protects beta-cells against apoptosis by increasing the activity of an IGF-2/IGF-1 receptor autocrine loop.Diabetes. 2009 Aug;58(8):1816-25. doi: 10.2337/db09-0063. Epub 2009 Apr 28. Diabetes. 2009. PMID: 19401425 Free PMC article.
-
Glucagon-like peptide-1 receptor is present in pancreatic acinar cells and regulates amylase secretion through cAMP.Am J Physiol Gastrointest Liver Physiol. 2016 Jan 1;310(1):G26-33. doi: 10.1152/ajpgi.00293.2015. Epub 2015 Nov 5. Am J Physiol Gastrointest Liver Physiol. 2016. PMID: 26542397 Free PMC article.
-
Anti-diabetic actions of glucagon-like peptide-1 on pancreatic beta-cells.Metabolism. 2014 Jan;63(1):9-19. doi: 10.1016/j.metabol.2013.09.010. Epub 2013 Oct 17. Metabolism. 2014. PMID: 24140094 Review.
-
Glucagon-like peptide 1-potentiated insulin secretion and proliferation of pancreatic β-cells.J Diabetes. 2014 Sep;6(5):394-402. doi: 10.1111/1753-0407.12161. Epub 2014 May 22. J Diabetes. 2014. PMID: 24725840 Review.
Cited by
-
GPCRs in Autocrine and Paracrine Regulations.Front Endocrinol (Lausanne). 2019 Jul 12;10:428. doi: 10.3389/fendo.2019.00428. eCollection 2019. Front Endocrinol (Lausanne). 2019. PMID: 31354618 Free PMC article. Review.
-
Incretins-Based Therapies and Their Cardiovascular Effects: New Game-Changers for the Management of Patients with Diabetes and Cardiovascular Disease.Pharmaceutics. 2023 Jul 1;15(7):1858. doi: 10.3390/pharmaceutics15071858. Pharmaceutics. 2023. PMID: 37514043 Free PMC article. Review.
-
Klf6 protects β-cells against insulin resistance-induced dedifferentiation.Mol Metab. 2020 May;35:100958. doi: 10.1016/j.molmet.2020.02.001. Epub 2020 Feb 6. Mol Metab. 2020. PMID: 32244185 Free PMC article.
-
Recent advances in understanding the role of glucagon-like peptide 1.F1000Res. 2020 Apr 6;9:F1000 Faculty Rev-239. doi: 10.12688/f1000research.20602.1. eCollection 2020. F1000Res. 2020. PMID: 32269764 Free PMC article. Review.
-
Cardiovascular effects of glucagon-like peptide 1 (GLP-1) receptor agonists.Cardiovasc Diabetol. 2014 Oct 22;13:142. doi: 10.1186/s12933-014-0142-7. Cardiovasc Diabetol. 2014. PMID: 25338737 Free PMC article. Review.
References
-
- Egan J. M., Bulotta A., Hui H., Perfetti R. (2003) Diabetes Metab. Res. Rev. 19, 115–123 - PubMed
-
- Drucker D. J. (2006) Cell Metab. 3, 153–165 - PubMed
-
- Gomez E., Pritchard C., Herbert T. P. (2002) J. Biol. Chem. 277, 48146–48151 - PubMed
-
- Arnette D., Gibson T. B., Lawrence M. C., January B., Khoo S., McGlynn K., Vanderbilt C. A., Cobb M. H. (2003) J. Biol. Chem. 278, 32517–32525 - PubMed
Publication types
MeSH terms
Substances
Grants and funding
LinkOut - more resources
Full Text Sources
Miscellaneous
