

Spatial patterns of cartilage loss in the medial femoral condyle in osteoarthritic knees: data from the Osteoarthritis Initiative
- PMID: 20146227
- PMCID: PMC3132941
- DOI: 10.1002/mrm.22194
Spatial patterns of cartilage loss in the medial femoral condyle in osteoarthritic knees: data from the Osteoarthritis Initiative
Abstract
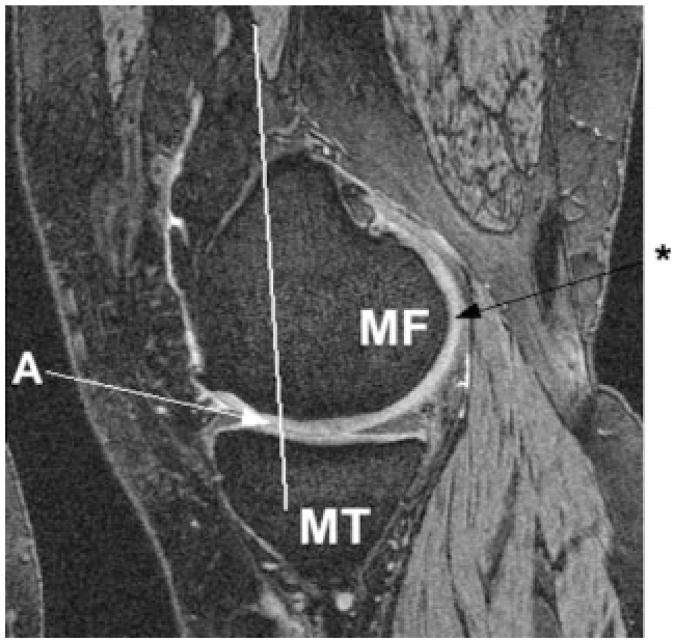
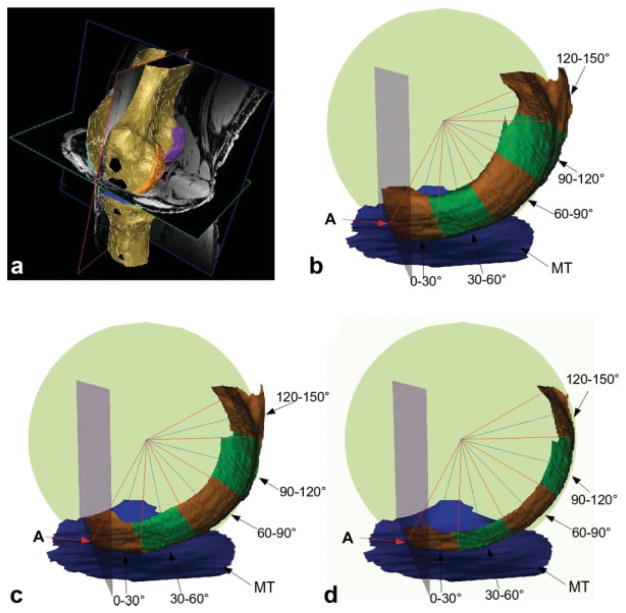
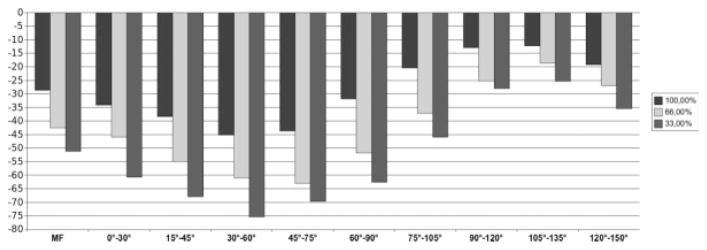
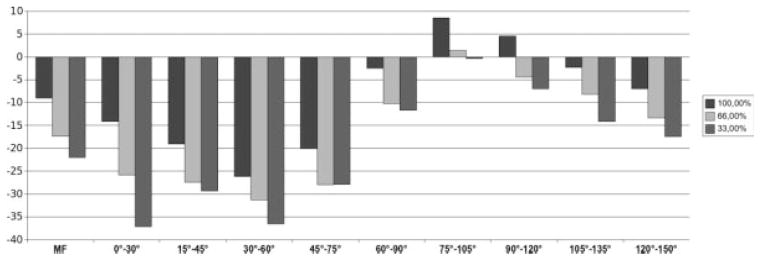
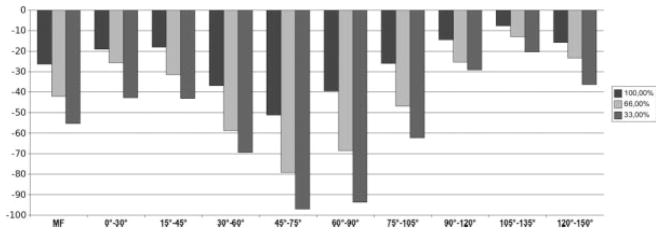
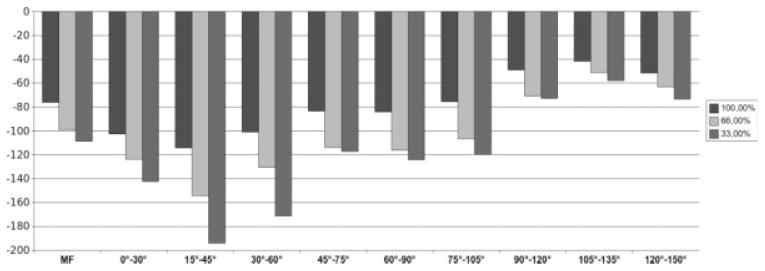
The objective of this study was to develop a technique for analyzing spatial patterns of cartilage loss in the medial femoral condyle (MF), and to study MF cartilage loss in participants of the Osteoarthritis Initiative. Using a 0.7 mm sagittal double echo at steady state (DESS) sequence, 160 osteoarthritic knees from 80 participants with varying degrees of medial joint space narrowing were imaged at baseline and 1-year follow-up. MF cartilage was segmented and cartilage loss determined. Rate of change varied significantly (P = 0.0067) along the anterior-posterior extension of the MF, with the greatest changes (-45 microm, -2.7%) observed 30-60 degrees posterior to the trochlear notch. The rate was greater in the central MF after excluding peripheral aspects of the MF from analysis. Sensitivity to change was greatest at 45-75 degrees (standardized response mean = -0.32) but was minimally affected by medial-lateral trimming. In conclusion, the greatest sensitivity to change was achieved when analyzing the posterior aspect of the central, weight-bearing MF.
(c) 2010 Wiley-Liss, Inc.
Figures
Similar articles
-
Magnitude and regional distribution of cartilage loss associated with grades of joint space narrowing in radiographic osteoarthritis--data from the Osteoarthritis Initiative (OAI).Osteoarthritis Cartilage. 2010 Jun;18(6):760-8. doi: 10.1016/j.joca.2009.12.009. Epub 2010 Feb 18. Osteoarthritis Cartilage. 2010. PMID: 20171298 Free PMC article.
-
Sensitivity to change of cartilage morphometry using coronal FLASH, sagittal DESS, and coronal MPR DESS protocols--comparative data from the Osteoarthritis Initiative (OAI).Osteoarthritis Cartilage. 2010 Apr;18(4):547-54. doi: 10.1016/j.joca.2009.12.003. Epub 2009 Dec 21. Osteoarthritis Cartilage. 2010. PMID: 20060948 Free PMC article.
-
Magnetic resonance imaging-based cartilage loss in painful contralateral knees with and without radiographic joint space narrowing: Data from the Osteoarthritis Initiative.Arthritis Rheum. 2009 Sep 15;61(9):1218-25. doi: 10.1002/art.24791. Arthritis Rheum. 2009. PMID: 19714595 Free PMC article.
-
The osteoarthritis initiative: report on the design rationale for the magnetic resonance imaging protocol for the knee.Osteoarthritis Cartilage. 2008 Dec;16(12):1433-41. doi: 10.1016/j.joca.2008.06.016. Epub 2008 Sep 10. Osteoarthritis Cartilage. 2008. PMID: 18786841 Free PMC article. Review.
-
Quantitative MRI of articular cartilage and its clinical applications.J Magn Reson Imaging. 2013 Nov;38(5):991-1008. doi: 10.1002/jmri.24313. Epub 2013 Oct 2. J Magn Reson Imaging. 2013. PMID: 24115571 Free PMC article. Review.
Cited by
-
Patterns of femoral cartilage thickness are different in asymptomatic and osteoarthritic knees and can be used to detect disease-related differences between samples.J Biomech Eng. 2013 Oct 1;135(10):101002-10. doi: 10.1115/1.4024629. J Biomech Eng. 2013. PMID: 23722563 Free PMC article.
-
Comparison of 1-year vs 2-year change in regional cartilage thickness in osteoarthritis results from 346 participants from the Osteoarthritis Initiative.Osteoarthritis Cartilage. 2011 Jan;19(1):74-83. doi: 10.1016/j.joca.2010.10.022. Epub 2010 Oct 31. Osteoarthritis Cartilage. 2011. PMID: 21044690 Free PMC article.
-
Comparison between coronal FLASH and sagittal double echo steady state MRI in detecting longitudinal cartilage thickness change by fully automated segmentation - Data from the FNIH biomarker cohort.Osteoarthr Cartil Open. 2025 Aug 5;7(3):100657. doi: 10.1016/j.ocarto.2025.100657. eCollection 2025 Sep. Osteoarthr Cartil Open. 2025. PMID: 40822965 Free PMC article.
-
Allogeneic umbilical cord blood-derived mesenchymal stem cell implantation versus microdrilling combined with high tibial osteotomy for cartilage regeneration.Sci Rep. 2024 Feb 9;14(1):3333. doi: 10.1038/s41598-024-53598-9. Sci Rep. 2024. PMID: 38336978 Free PMC article.
-
Biomechanics of the medial meniscus in the osteoarthritic knee joint.PeerJ. 2021 Nov 24;9:e12509. doi: 10.7717/peerj.12509. eCollection 2021. PeerJ. 2021. PMID: 34900428 Free PMC article.
References
-
- Eckstein F, Burstein D, Link TM. Quantitative MRI of cartilage and bone: degenerative changes in osteoarthritis. NMR Biomed. 2006;19:822–854. - PubMed
-
- Eckstein F, Cicuttini F, Raynauld JP, Waterton JC, Peterfy C. Magnetic resonance imaging (MRI) of articular cartilage in knee osteoarthritis (OA): morphological assessment. Osteoarthritis Cartilage. 2006;14(suppl 1):46–75. - PubMed
-
- Maquet P, Van De BA, Simonet J. The weight-bearing surfaces of the femoro-tibial joint. Acta Orthop Belg. 1976;42(suppl 1):139–143. - PubMed
-
- Brandt KD, Mazzuca SA, Conrozier T, Dacre JE, Peterfy CG, Provvedini D, Ravaud P, Taccoen A, Vignon E. Which is the best radiographic protocol for a clinical trial of a structure modifying drug in patients with knee osteoarthritis? J Rheumatol. 2002;29:1308–1320. - PubMed
-
- Guermazi A, Burstein D, Conaghan P, Eckstein F, Hellio Le Graverand-Gastineau MP, Keen H, Roemer FW. Imaging in osteoarthritis. Rheum Dis Clin North Am. 2008;34:645–687. - PubMed
Publication types
MeSH terms
Grants and funding
LinkOut - more resources
Full Text Sources
Medical
