. 2010 Mar 1;82(5):1881-9.
doi: 10.1021/ac9026115.

Structural characterization of phospholipids and peptides directly from tissue sections by MALDI traveling-wave ion mobility-mass spectrometry

Affiliations

Structural characterization of phospholipids and peptides directly from tissue sections by MALDI traveling-wave ion mobility-mass spectrometry

Whitney B Ridenour et al. Anal Chem. .

Abstract

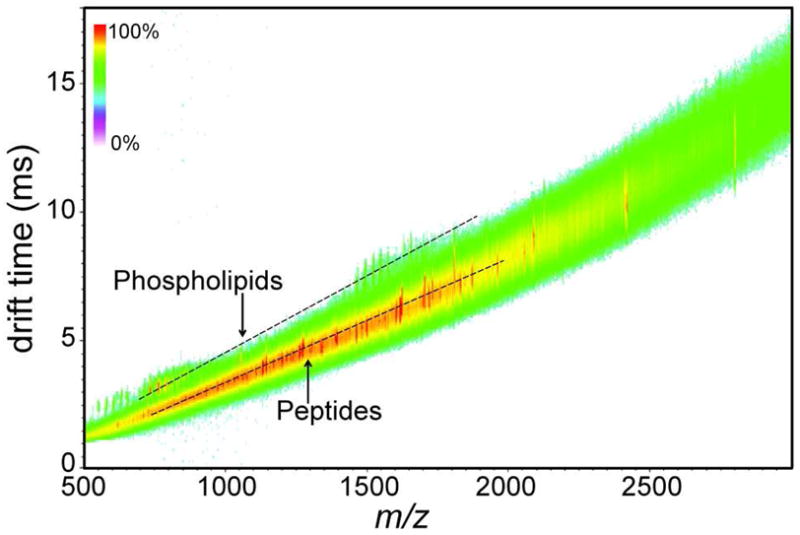
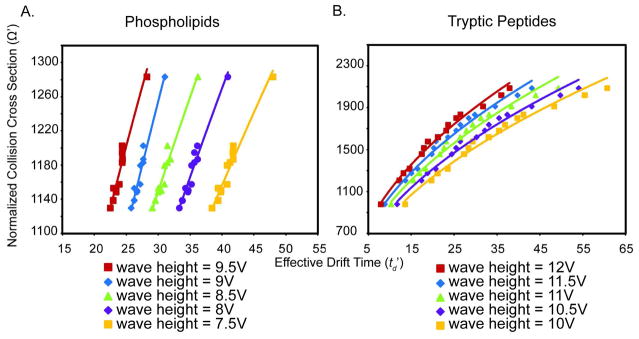
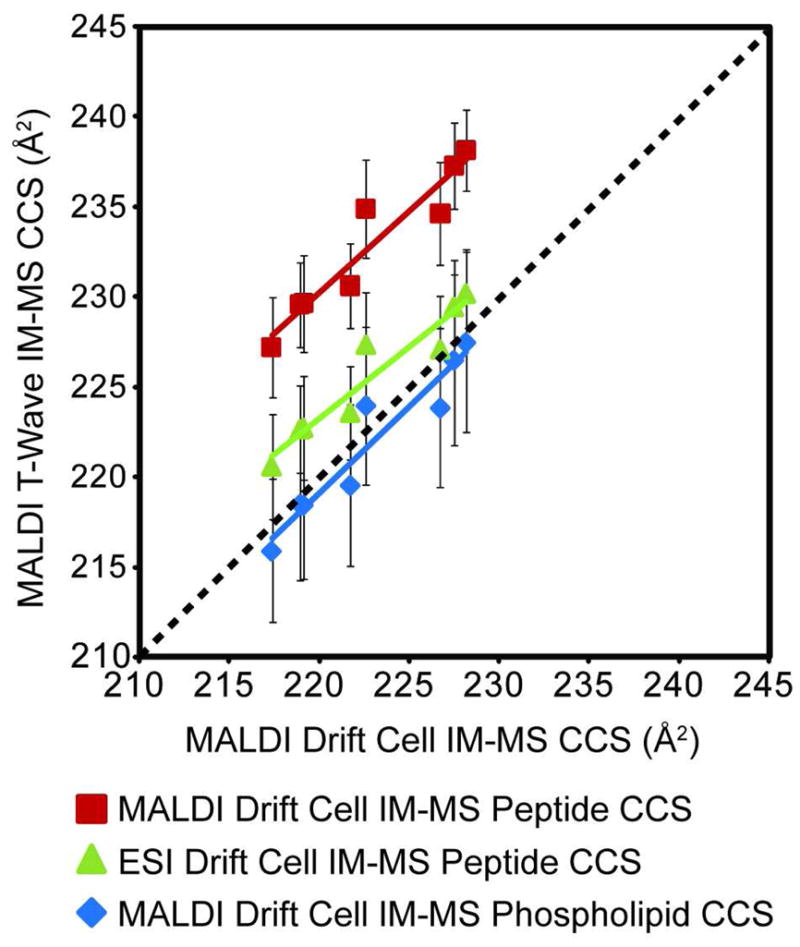
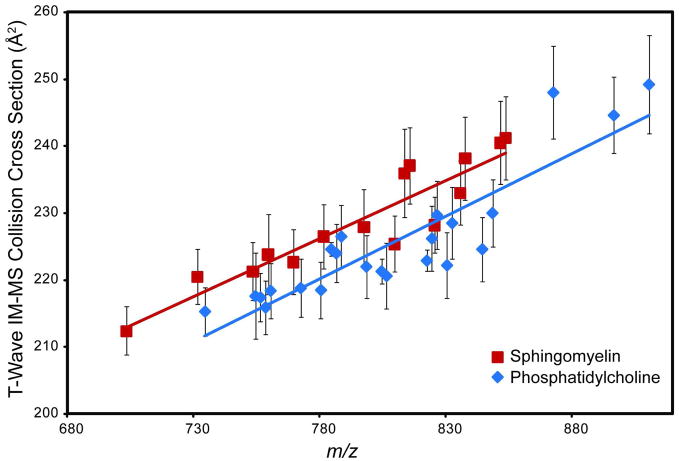
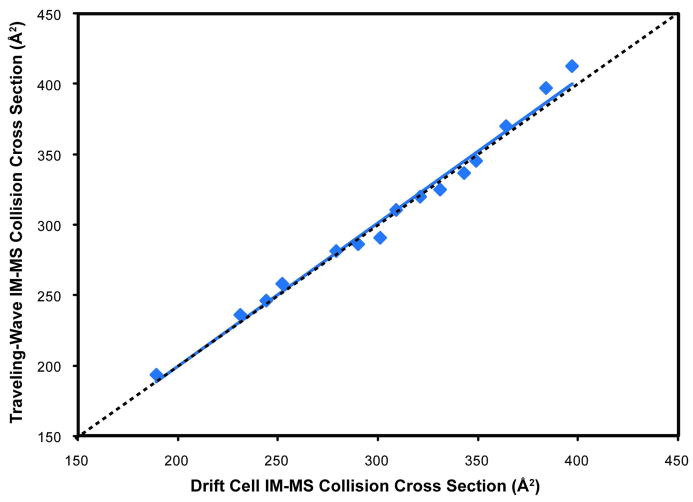
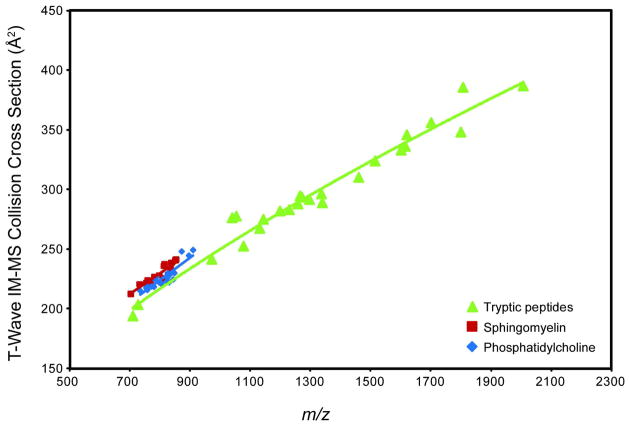
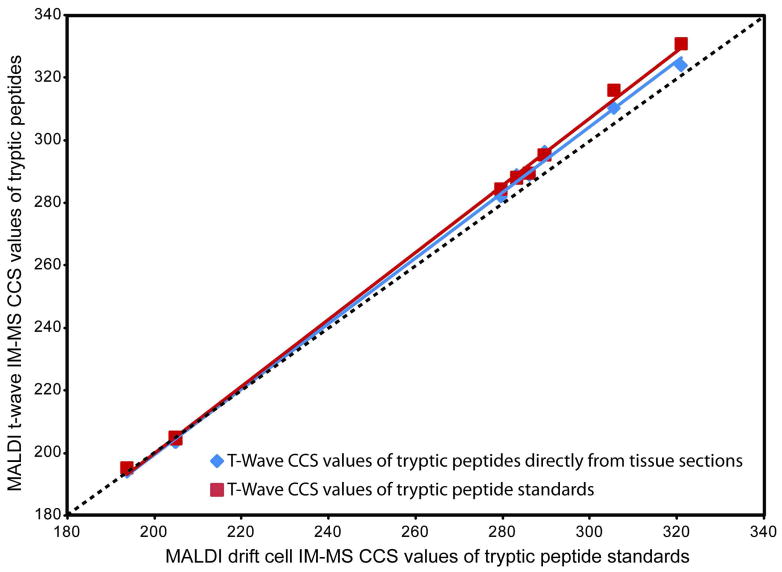
Ion mobility-mass spectrometry (IM-MS) provides rapid two-dimensional separations based on analyte apparent surface area or collision cross section (CCS, A(2)) and mass-to-charge, respectively. Recently, traveling-wave (t-wave) IM-MS was developed which uses electrodynamic rather than electrostatic fields commonly used in drift cell IM-MS instruments. The underlying theory for obtaining CCS data is well developed for drift cell IM-MS, while strategies for obtaining CCS values from t-wave IM-MS data remains an active area of research. In this report, methods were developed and validated to obtain CCS values of phospholipids and peptides directly from thin tissue sections by MALDI t-wave IM-MS using CCS calibrants measured by MALDI drift cell IM-MS. Importantly, the average percent difference between t-wave and drift cell CCS measurements is minimized by calibrating with the same biomolecular class. Calibrating t-wave phospholipid CCS values with drift cell peptide CCS measurements results in an average percent difference of ca. 7% between the same lipids measured using t-wave and drift cell IM-MS, while this improves to <0.5% when drift cell phospholipid CCS values are used for calibrating t-wave data. A suite of CCS values are reported for lipids and peptides that were determined directly from tissue, i.e. without the need for tissue extraction and further purification steps.


Figures

FIGURE 1
FIGURE 1
Measuring CCS values of phospholipids and tryptic peptides directly from rat brain tissue sections by MALDI t-wave IM-MS. A typical two-dimensional td versus m/z plot of a rat brain tissue section after trypsin application collected by MALDI t-wave IM-MS. The predicted correlation of drift time versus m/z for phospholipids and tryptic peptides at these experimental conditions are indicated by dashed lines for visualization purposes. Signal intensity is indicated by the displayed false color scale.
FIGURE 2
FIGURE 2
Calibration curves of normalized CCS versus effective drift time used to estimate CCS values of (A) phospholipids and (B) tryptic peptides directly from tissue sections. Data from 5 different wave heights are each plotted whereby the correlation line represents a power fit to the data. Since t-wave IM-MS CCS values were calculated using the td values obtained directly from a complex sample, only td values for peaks containing a single species when analyzed by FTICR were used. Calibration curves of phospholipid standards have R2 values > 0.95 and calibration curves of BSA tryptic peptides have R2 values > 0.98.
FIGURE 3
FIGURE 3
Comparison of PC CCS results based on using tryptic peptide CCS and phospholipids CCS values as calibrants. MALDI t-wave IM-MS CCS values for PC species that were calibrated using either tryptic peptide CCS values (red) or phospholipid CCS values (blue) measured using MALDI drift cell IM-MS or CCS values (green) measured by ESI drift cell IM-MS., , Error bars represent ± 1σ for 5 different wave heights collected over 2 days (n=10).
FIGURE 4
FIGURE 4
MALDI t-wave IM-MS CCS values of phospholipids obtained directly from tissue sections. Specific phospholipid species were identified by FTICR and MS/MS directly from tissue sections. MALDI t-wave IM-MS CCS values were determined using drift cell IM-MS phospholipid CCS values as calibrants. Error bars represent ± 1σ for 5 different wave heights collected over 2 days (n=10). The two SM species which fall on the PC trend-line were identified as [SM 22:0 + Na]+ and [SM 22:0 + K]+.
FIGURE 5
FIGURE 5
MALDI t-wave IM-MS tryptic peptide CCS values from an in-solution digest. T-wave IM-MS CCS values of tryptic peptides from a BSA digest were determined using BSA tryptic peptide CCS values measured by MALDI drift cell IM-MS as calibrants. The error bars (all are < 2.0%) represent ± 1σ for 5 different wave heights collected over 2 days (n=10). Correlation between MALDI drift cell IM-MS and MALDI t-wave IM-MS CCS values result in an R2 value > 0.98, where the dashed line represents a 1:1 correlation.
FIGURE 6
FIGURE 6
MALDI t-wave IM-MS CCS values of tryptic peptides measured directly from tissue sections. CCS values were calibrated using MALDI drift tube IM-MS CCS values of BSA tryptic peptides as calibrants. Only the CCS values of confidently identified tryptic peptides sequenced by high mass accuracy and MS/MS directly from tissue sections are displayed (Table 3). Error bars (average error is < 1.5%) represent ± 1σ for 5 different wave heights collected over 2 days (n=10). For reference, SM and PC trend-lines are plotted illustrating that peptides have a lower CCS than phospholipid species of the same m/z.
Figure 7
Figure 7
Validation of MALDI t-wave IM-MS CCS values directly from tissue in comparison with those from an in solution digest. Both MALDI t-wave IM-MS and MALDI drift cell IM-MS CCS values are an average of 5 different wave heights and electrostatic fields, respectively, over two days (n = 10). Error bars represent ± 1σ. The dashed line represents a 1:1 correlation between MALDI t-wave IM-MS and MALDI drift cell IM-MS CCS values.

Similar articles

Cited by

References

    1. McLean JA, Ruotolo BT, Gillig KJ, Russell DH. International Journal of Mass Spectrometry. 2005;240:301–315.
    1. Valentine SJ, Liu XY, Plasencia MD, Hilderbrand AE, Kurulugama RT, Koeniger SL, Clemmer DE. Expert Review of Proteomics. 2005;2:553–565. - PubMed
    1. Wyttenbach T, Bowers MT. Annual Review of Physical Chemistry. 2007;58:511–533. - PubMed
    1. Kanu AB, Dwivedi P, Tam M, Matz L, Hill HH., Jr Journal of Mass Spectrometry. 2008;43:1–22. - PubMed
    1. Jackson SN, Ugarov M, Egan T, Post JD, Langlais D, Schultz JA, Woods AS. Journal of Mass Spectrometry. 2007;42:1093–1098. - PMC - PubMed

Publication types

MeSH terms