

Behavior of the electrocardiographic T peak to end interval in childhood
- PMID: 20146777
- PMCID: PMC6932471
- DOI: 10.1111/j.1542-474X.2009.00334.x
Behavior of the electrocardiographic T peak to end interval in childhood
Abstract
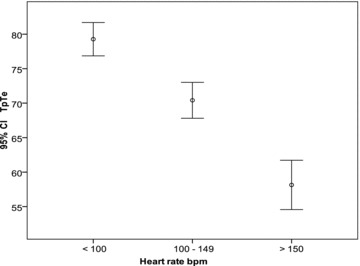
Background: The T-wave peak to T-wave end (TpTe) interval reflects spatial and transmural dispersion in repolarization and serves as an arrhythmogenic index. Normal TpTe interval data in children are lacking. We evaluated the effects of age, gender, heart rate, leads (II and V(5)) on TpTe and T-wave voltage.
Methods: Four hundred healthy children (age 4 days to 16.7 years) were enrolled. From a resting 12-lead digital ECG, TpTe, RR, QT, JT intervals, and T amplitude were measured (leads II and V(5)). Bazett and Fridericia formulas were applied to TpTe for heart rate correction and TpTe/QT and TpTe/JT were calculated. Descriptive and analytical statistics were applied, significance level set at P < or = 0.05.
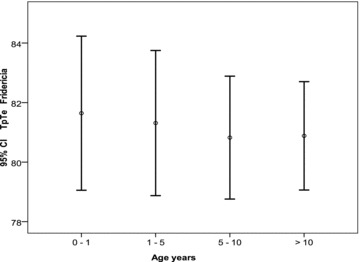
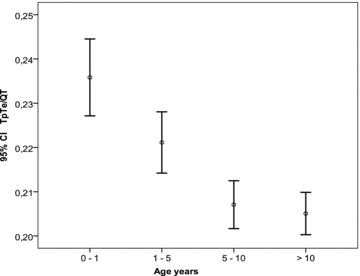
Results: TpTe in leads II and V(5) correlate well. Contrary to adults, no gender differences in TpTe were observed in childhood. TpTe lengthens with increasing age, and is inversely related to heart rate. TpTe 98th percentile is 85 msec in first 5 years, increasing to 92 msec in adolescence. TpTe Fridericia is a good correction formula in childhood; TpTe Bazett overcorrects in the younger age. TpTe/QT and TpTe/JT are longer in younger subjects due to greater QT shortening than the TpTe interval at higher heart rates.
Conclusions: In children, TpTe in lead II and V(5) correlate well. The TpTe interval lengthens with advancing age as heart rate diminishes. TpTe Fridericia is a good correction formula in children. Younger subjects have higher TpTe/QT and TpTe/JT indices compared to older children. T-wave voltage increases with age, tallest in the 5-10-year-age group particularly in V(5).
Figures
Similar articles
-
Tpeak -tend interval in 12-lead electrocardiogram of healthy children and adolescents tpeak -tend interval in childhood.Ann Noninvasive Electrocardiol. 2013 Jul;18(4):344-51. doi: 10.1111/anec.12035. Epub 2013 Jan 20. Ann Noninvasive Electrocardiol. 2013. PMID: 23879274 Free PMC article.
-
Circadian and gender effects on repolarization in healthy adults: a study using harmonic regression analysis.Ann Noninvasive Electrocardiol. 2010 Jan;15(1):3-10. doi: 10.1111/j.1542-474X.2009.00333.x. Ann Noninvasive Electrocardiol. 2010. PMID: 20146776 Free PMC article.
-
Study of repolarization heterogeneity and electrocardiographic morphology with a modeling approach.J Electrocardiol. 2008 Nov-Dec;41(6):581-7. doi: 10.1016/j.jelectrocard.2008.07.027. Epub 2008 Sep 19. J Electrocardiol. 2008. PMID: 18804785
-
Ventricular repolarization heterogeneity in patients with COVID-19: Original data, systematic review, and meta-analysis.Clin Cardiol. 2022 Jan;45(1):110-118. doi: 10.1002/clc.23767. Epub 2022 Jan 10. Clin Cardiol. 2022. PMID: 35005792 Free PMC article.
-
Transmural dispersion of repolarization and arrhythmogenicity: the Brugada syndrome versus the long QT syndrome.J Electrocardiol. 1999;32 Suppl:158-65. doi: 10.1016/s0022-0736(99)90074-2. J Electrocardiol. 1999. PMID: 10688320 Review.
Cited by
-
Tpeak -tend interval in 12-lead electrocardiogram of healthy children and adolescents tpeak -tend interval in childhood.Ann Noninvasive Electrocardiol. 2013 Jul;18(4):344-51. doi: 10.1111/anec.12035. Epub 2013 Jan 20. Ann Noninvasive Electrocardiol. 2013. PMID: 23879274 Free PMC article.
-
Predicting Long-Term Ventricular Arrhythmia Risk in Children with Acute Lymphoblastic Leukemia Using Normal Values of Ventricular Repolarization Markers Established from Japanese Cohort Study.J Clin Med. 2023 Jul 17;12(14):4723. doi: 10.3390/jcm12144723. J Clin Med. 2023. PMID: 37510838 Free PMC article.
-
Ventricular Repolarization Dispersion is a Potential Risk for the Development of Life-Threatening Arrhythmia in Children with Hypertrophic Cardiomyopathy.Pediatr Cardiol. 2022 Oct;43(7):1455-1461. doi: 10.1007/s00246-022-02867-3. Epub 2022 Mar 13. Pediatr Cardiol. 2022. PMID: 35284943
-
Sex differences in cardiac autonomic regulation and in repolarisation electrocardiography.Pflugers Arch. 2013 May;465(5):699-717. doi: 10.1007/s00424-013-1228-x. Epub 2013 Feb 13. Pflugers Arch. 2013. PMID: 23404618 Review.
-
Clinical determinants of electrocardiographic and spatial vectorcardiographic descriptors of ventricular repolarization in healthy children.Ann Noninvasive Electrocardiol. 2011 Jan;16(1):49-55. doi: 10.1111/j.1542-474X.2010.00408.x. Ann Noninvasive Electrocardiol. 2011. PMID: 21251134 Free PMC article.
References
-
- Xue J, Gao W, Chen Y, et al Study of repolarization heterogeneity and electrocardiographic morphology with a modeling approach. J Electrocardiol 2008;41:581–587. - PubMed
-
- Yan GX, Antzelevitch C. Cellular basis for the normal T wave and the electrocardiographic manifestations of the long‐QT syndrome. Circulation 1998;98:1928–1936. - PubMed
-
- Yan GX, Shimizu W, Antzelevitch C. The characteristics and distribution of M cells in arterially‐perfused canine left ventricular wedge preparations. Circulation 1998;98:1921–1927. - PubMed
MeSH terms
LinkOut - more resources
Full Text Sources
Other Literature Sources
