

Abnormal P-wave morphology is a predictor of atrial fibrillation development and cardiac death in MADIT II patients
- PMID: 20146784
- PMCID: PMC6932689
- DOI: 10.1111/j.1542-474X.2009.00341.x
Abnormal P-wave morphology is a predictor of atrial fibrillation development and cardiac death in MADIT II patients
Abstract
Background: Several ECG-based approaches have been shown to add value when risk-stratifying patients with congestive heart failure, but little attention has been paid to the prognostic value of abnormal atrial depolarization in this context. The aim of this study was to noninvasively analyze the atrial depolarization phase to identify markers associated with increased risk of mortality, deterioration of heart failure, and development of atrial fibrillation (AF) in a high-risk population with advanced congestive heart failure and a history of acute myocardial infarction.
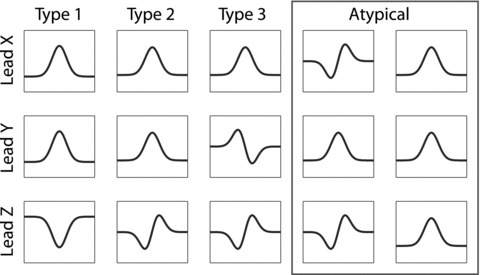
Methods: Patients included in the Multicenter Automatic Defibrillator Implantation Trial II (MADIT II) with sinus rhythm at baseline were studied (n = 802). Unfiltered and band-pass filtered signal-averaged P waves were analyzed to determine orthogonal P-wave morphology (prespecified types 1, 2, and 3/atypical), P-wave duration, and RMS20. The association between P-wave parameters and data on the clinical course and cardiac events during a mean follow-up of 20 months was analyzed.
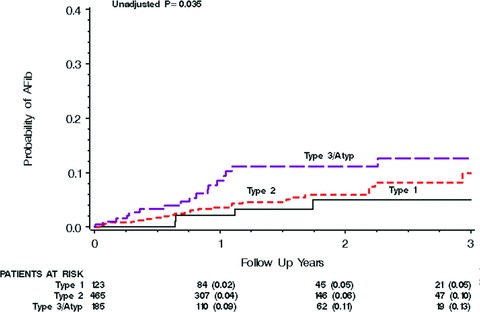
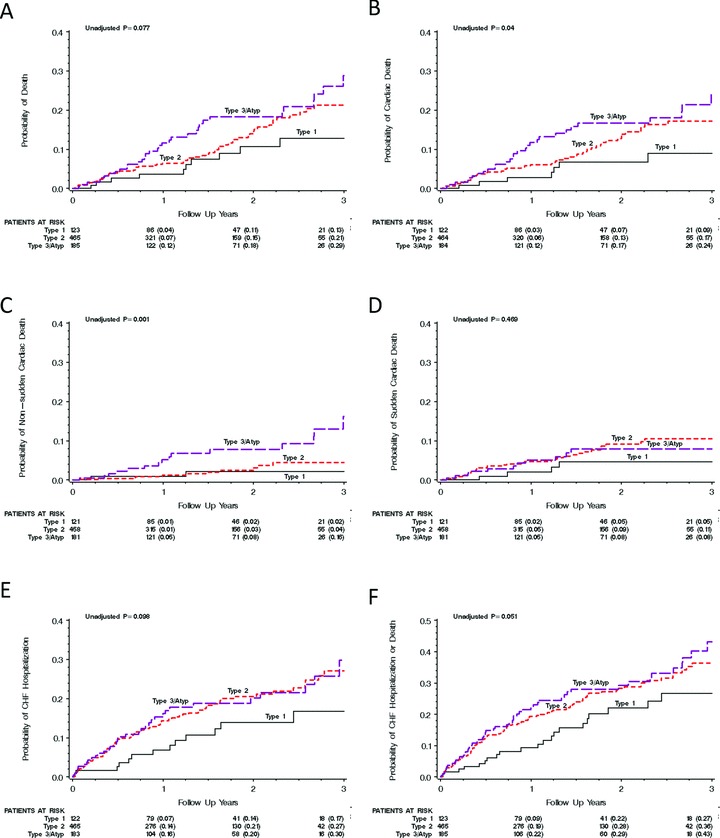
Results: P-wave duration was 139 + or - 23 ms and the RMS20 was 1.9 + or - 1.1 microV. None of these parameters was significantly associated with poor cardiac outcome or AF development. After adjustment for clinical covariates, abnormal P-wave morphology was found to be independently predictive of nonsudden cardiac death (HR 2.66; 95% CI 1.41-5.04, P = 0.0027) and AF development (HR 1.75; 95% CI 1.10-2.79, P = 0.019).
Conclusion: Abnormalities in P-wave morphology recorded from orthogonal leads in surface ECG are independently predictive of increased risk of nonsudden cardiac death and AF development in MADIT II patients.
Figures
Similar articles
-
Altered interatrial conduction detected in MADIT II patients bound to develop atrial fibrillation.Ann Noninvasive Electrocardiol. 2009 Jul;14(3):268-75. doi: 10.1111/j.1542-474X.2009.00309.x. Ann Noninvasive Electrocardiol. 2009. PMID: 19614639 Free PMC article. Clinical Trial.
-
Implantable cardioverter-defibrillator therapy and risk of congestive heart failure or death in MADIT II patients with atrial fibrillation.Heart Rhythm. 2006 Jun;3(6):631-7. doi: 10.1016/j.hrthm.2006.02.012. Epub 2006 Feb 28. Heart Rhythm. 2006. PMID: 16731460
-
Microvolt T-wave alternans distinguishes between patients likely and patients not likely to benefit from implanted cardiac defibrillator therapy: a solution to the Multicenter Automatic Defibrillator Implantation Trial (MADIT) II conundrum.Circulation. 2004 Oct 5;110(14):1885-9. doi: 10.1161/01.CIR.0000143160.14610.53. Epub 2004 Sep 27. Circulation. 2004. PMID: 15451804
-
P-wave morphology: underlying mechanisms and clinical implications.Ann Noninvasive Electrocardiol. 2012 Jul;17(3):161-9. doi: 10.1111/j.1542-474X.2012.00534.x. Ann Noninvasive Electrocardiol. 2012. PMID: 22816534 Free PMC article. Review.
-
Noninvasive risk stratification in postinfarction patients with severe left ventricular dysfunction and methodology of the MADIT II noninvasive electrocardiology substudy.J Electrocardiol. 2003;36 Suppl:101-8. doi: 10.1016/j.jelectrocard.2003.09.022. J Electrocardiol. 2003. PMID: 14716600 Review.
Cited by
-
Association of vitamin D deficiency with electrocardiographic markers of left atrial abnormalities.Ann Noninvasive Electrocardiol. 2019 May;24(3):e12626. doi: 10.1111/anec.12626. Epub 2019 Jan 19. Ann Noninvasive Electrocardiol. 2019. PMID: 30659705 Free PMC article.
-
The Diagnosis and Clinical Implications of Interatrial Block.Eur Cardiol. 2015 Jul;10(1):54-59. doi: 10.15420/ecr.2015.10.01.54. Eur Cardiol. 2015. PMID: 30310424 Free PMC article. Review.
-
Number of P-wave fragmentations on P-SAECG correlates with infiltrated atrial fat.Ann Noninvasive Electrocardiol. 2014 Mar;19(2):114-21. doi: 10.1111/anec.12084. Epub 2013 Sep 9. Ann Noninvasive Electrocardiol. 2014. PMID: 24620844 Free PMC article.
-
Atrial fibrillation in the elderly.J Geriatr Cardiol. 2017 Mar;14(3):155-157. doi: 10.11909/j.issn.1671-5411.2017.03.012. J Geriatr Cardiol. 2017. PMID: 28592955 Free PMC article. No abstract available.
-
Notched P-wave on digital electrocardiogram predicts the recurrence of atrial fibrillation in patients who have undergone catheter ablation.J Arrhythm. 2024 May 2;40(3):472-478. doi: 10.1002/joa3.13050. eCollection 2024 Jun. J Arrhythm. 2024. PMID: 38939783 Free PMC article.
References
-
- Hunt SA, Abraham WT, Chin MH, et al ACC/AHA 2005 Guideline update for the diagnosis and management of chronic heart failure in the adult: A report of the American College of Cardiology/American Heart Association Task Force on practice guidelines (Writing Committee to update the 2001 guidelines for the evaluation and management of heart failure): Developed in collaboration with the American College of Chest Physicians and the International Society for Heart and Lung Transplantation: Endorsed by the Heart Rhythm Society. Circulation 2005;112:e154–e235. - PubMed
-
- Cowburn PJ, Cleland JG, Coats AJ, et al Risk stratification in chronic heart failure. Eur Heart J 1998;19:696–710. - PubMed
-
- Kentala E, Pyorala K, Heikkila J, et al Factors related to long‐term prognosis following acute myocardial infarction. Importance of left ventricular function. Scand J Rehabil Med 1975;7:118–124. - PubMed
-
- Pohjola S, Siltanen P, Romo M. The prognostic value of the P wave morphology in the discharge ECG in a 5‐year follow‐up study after myocardial infarction. Am Heart J 1979;98:32–38. - PubMed
Publication types
MeSH terms
LinkOut - more resources
Full Text Sources
Medical
