

P-wave indices, distribution and quality control assessment (from the Framingham Heart Study)
- PMID: 20146786
- PMCID: PMC2901840
- DOI: 10.1111/j.1542-474X.2009.00343.x
P-wave indices, distribution and quality control assessment (from the Framingham Heart Study)
Abstract
Background: P-wave indices of maximum P-wave duration and P-wave dispersion have been examined in a broad array of cardiovascular and noncardiovascular disease states. The P-wave indices literature has been highly heterogeneous in measurement methodologies, described quality control metrics, and distribution of values. We therefore sought to determine the reproducibility of P-wave indices in a community-based cohort.
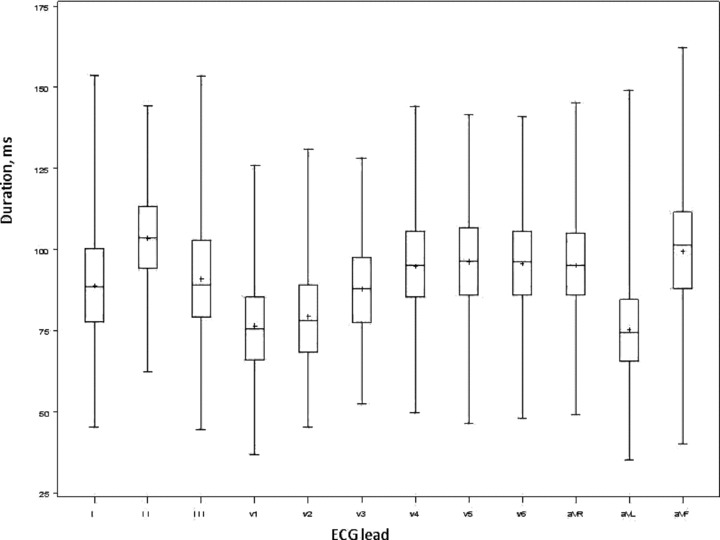
Methods: P-wave indices were measured in sequential subjects enrolled in the Framingham Heart Study. Electrocardiograms were obtained at the 11th biennial visit of the Original Cohort (n = 250) and the initial visit of the Offspring Cohort (n = 252). We determined the mean P-wave durations, interlead correlations, and P-wave indices. We then chose 20 ECGs, 10 from each cohort, and assessed intrarater and interrater variability.
Results: The maximum P-wave duration ranged from 71 to 162 ms with mean of 112 + or - 12 ms. The minimum P-wave duration ranged from 35 to 103 ms with mean of 65 + or - 10 ms. P-wave dispersion ranged from 12 to 82 ms. The mean P-wave dispersion was 48 + or - 12 ms (40-56). The intrarater intraclass correlation coefficient (ICC) was r = 0.80 for maximum P-wave duration and r = 0.82 for P-wave dispersion. The interrater ICC was 0.56 for maximum P-wave duration and 0.70 for P-wave dispersion.
Conclusions: We demonstrated excellent intrarater reproducibility and fair interrater reproducibility for calculating P-wave indices. Reproducibility is frequently lacking in studies of P-wave indices, but is an essential component for the field's growth and epidemiologic contribution.
Figures
Similar articles
-
P-wave indices: derivation of reference values from the Framingham Heart Study.Ann Noninvasive Electrocardiol. 2010 Oct;15(4):344-52. doi: 10.1111/j.1542-474X.2010.00390.x. Ann Noninvasive Electrocardiol. 2010. PMID: 20946557 Free PMC article.
-
Assessment of reproducibility--automated and digital caliper ECG measurement in the Framingham Heart Study.J Electrocardiol. 2014 May-Jun;47(3):288-93. doi: 10.1016/j.jelectrocard.2014.01.004. Epub 2014 Jan 6. J Electrocardiol. 2014. PMID: 24792985 Free PMC article.
-
Short-term repeatability of electrocardiographic P wave indices and PR interval.J Electrocardiol. 2014 Mar-Apr;47(2):257-63. doi: 10.1016/j.jelectrocard.2013.11.007. Epub 2013 Nov 25. J Electrocardiol. 2014. PMID: 24360345 Free PMC article.
-
Measurement and interpretation of QT dispersion.Prog Cardiovasc Dis. 2000 Mar-Apr;42(5):325-44. doi: 10.1053/pcad.2000.0420325. Prog Cardiovasc Dis. 2000. PMID: 10768311 Review.
-
P-wave dispersion: a novel predictor of paroxysmal atrial fibrillation.Ann Noninvasive Electrocardiol. 2001 Apr;6(2):159-65. doi: 10.1111/j.1542-474x.2001.tb00101.x. Ann Noninvasive Electrocardiol. 2001. PMID: 11333174 Free PMC article. Review.
Cited by
-
The Effect of Dapagliflozin Treatment on Epicardial Adipose Tissue Volume and P-Wave Indices: An Ad-hoc Analysis of The Previous Randomized Clinical Trial.J Atheroscler Thromb. 2020 Dec 1;27(12):1348-1358. doi: 10.5551/jat.48009. Epub 2020 Feb 28. J Atheroscler Thromb. 2020. PMID: 32115470 Free PMC article. Clinical Trial.
-
Fragmented QRS in patients with preeclampsia.Arch Gynecol Obstet. 2024 Dec;310(6):2873-2878. doi: 10.1007/s00404-024-07755-0. Epub 2024 Oct 5. Arch Gynecol Obstet. 2024. PMID: 39367973
-
P-wave dispersion for predicting paroxysmal atrial fibrillation in acute ischemic stroke.Int J Med Sci. 2012;9(1):108-14. doi: 10.7150/ijms.9.108. Epub 2011 Dec 17. Int J Med Sci. 2012. PMID: 22211098 Free PMC article.
-
[Change in P wave on electrocardiogram and its diagnostic value in children and adolescents with cardioinhibitory vasovagal syncope].Zhongguo Dang Dai Er Ke Za Zhi. 2019 Nov;21(11):1084-1088. doi: 10.7499/j.issn.1008-8830.2019.11.006. Zhongguo Dang Dai Er Ke Za Zhi. 2019. PMID: 31753089 Free PMC article. Chinese.
-
Electrocardiographic Left Atrial Abnormality and Risk of Stroke: Northern Manhattan Study.Stroke. 2015 Nov;46(11):3208-12. doi: 10.1161/STROKEAHA.115.009989. Epub 2015 Sep 22. Stroke. 2015. PMID: 26396031 Free PMC article.
References
-
- Aytemir K, Ozer N, Atalar E, et al P wave dispersion on 12‐lead electrocardiography in patients with paroxysmal atrial fibrillation. Pacing Clin Electrophysiol 2000;23:1109–1112. - PubMed
-
- Dilaveris PE, Gialafos EJ, Sideris SK, et al Simple electrocardiographic markers for the prediction of paroxysmal idiopathic atrial fibrillation. Am Heart J 1998;135:733–738. - PubMed
-
- Boriani G, Diemberger I, Biffi M, et al P wave dispersion and short‐term versus late atrial fibrillation recurrences after cardioversion. Int J Cardiol 2005;101:355–361. - PubMed
Publication types
MeSH terms
Grants and funding
LinkOut - more resources
Full Text Sources
