. 2010;11(2):R17.
doi: 10.1186/gb-2010-11-2-r17. Epub 2010 Feb 8.

Genome-wide analysis of the diatom cell cycle unveils a novel type of cyclins involved in environmental signaling

Affiliations

Genome-wide analysis of the diatom cell cycle unveils a novel type of cyclins involved in environmental signaling

Marie J J Huysman et al. Genome Biol. 2010.

Abstract

Background: Despite the enormous importance of diatoms in aquatic ecosystems and their broad industrial potential, little is known about their life cycle control. Diatoms typically inhabit rapidly changing and unstable environments, suggesting that cell cycle regulation in diatoms must have evolved to adequately integrate various environmental signals. The recent genome sequencing of Thalassiosira pseudonana and Phaeodactylum tricornutum allows us to explore the molecular conservation of cell cycle regulation in diatoms.

Results: By profile-based annotation of cell cycle genes, counterparts of conserved as well as new regulators were identified in T. pseudonana and P. tricornutum. In particular, the cyclin gene family was found to be expanded extensively compared to that of other eukaryotes and a novel type of cyclins was discovered, the diatom-specific cyclins. We established a synchronization method for P. tricornutum that enabled assignment of the different annotated genes to specific cell cycle phase transitions. The diatom-specific cyclins are predominantly expressed at the G1-to-S transition and some respond to phosphate availability, hinting at a role in connecting cell division to environmental stimuli.

Conclusion: The discovery of highly conserved and new cell cycle regulators suggests the evolution of unique control mechanisms for diatom cell division, probably contributing to their ability to adapt and survive under highly fluctuating environmental conditions.


Figures
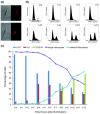
Figure 1
Figure 1
Synchronization of the cell cycle in P. tricornutum. (a) Confocal images of a dark-arrested cell (upper panel) showing a single parietal chloroplast and a cell after 12 h illumination (lower panel) showing divided and translocated daughter chloroplasts. Red, autofluorescence of the chloroplast. Scale bar: 5 μm. (b) Validation of synchronization of the cell cycle of P. tricornutum by flow cytometry. DNA content (abscissa) is plotted against cell number (ordinate). After a 20-h dark period, most of the cells are blocked in G1 phase (t = 0 to 4 h), indicated by the single 2C peak. After reillumination, cells proceed synchronously with their cell cycle, going through S phase (between t = 4 and 7 h), visible as the broadening and lowering of the 2C peak, and G2-M phase (t = 8 to 12 h), indicated by the accumulation of 4C cells. (c) Histogram indicating the proportion of cells in a certain cell cycle phase and chloroplast conformation during the cell cycle. Divided chloroplasts were observed starting from 5 h after illumination, after S-phase onset.
Figure 2
Figure 2
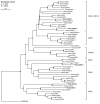
Phylogenetic analysis of the cyclin-dependent kinases of P. tricornutum. Neighbor-joining tree (TREECON, Poisson correction, 1,000 replicates) of the CDK family. The P. tricornutum sequences are shown in bold. Abbreviations: Arath, Arabidopsis thaliana; Drome, Drosophila melanogaster; Homsa, Homo sapiens; Lyces, Lycopersicon esculentum; Medsa, Medicago sativa; Musmu, Mus musculus; Nicta, Nicotiana tabacum; Oryja, Oryza japonica; Orysa, Oryza sativa; Ostta, Ostreococcus tauri; Phatr, Phaeodactylum tricornutum; Sacce, Saccharomyces cerevisiae; Schpo, Schizosaccharomyces pombe; Thaps, Thalassiosira pseudonana; and Xenla, Xenopus laevis.
Figure 3
Figure 3
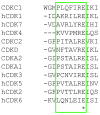
Cyclin-dependent kinase cyclin-binding motifs. Alignment of the cyclin-binding motifs of all annotated CDKs in P. tricornutum. The motifs are indicated in the green box. Conserved residues are marked by an asterix in the bottom line.
Figure 4
Figure 4
Hierarchical average linkage clustering of the expression profiles of cyclin-dependent kinases and their interactors in P. tricornutum. (a) Members of the CDK family. (b) CKS1. h, hypothetical.
Figure 5
Figure 5
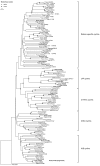
Phylogenetic analysis of the cyclins of P. tricornutum. Neighbor-joining tree (TREECON, Poisson correction, 500 replicates) of the cyclin family. The P. tricornutum sequences are shown in bold. Abbreviations: Arath, Arabidopsis thaliana; Homsa, Homo sapiens; Ostta, Ostreococcus tauri; Phatr, Phaeodactylum tricornutum; and Thaps, Thalassiosira pseudonana.
Figure 6
Figure 6
Hierarchical average linkage clustering of the expression profiles of cyclin genes in P. tricornutum. (a) Cyclin genes. (b) dsCYCs. ds, diatom specific.
Figure 7
Figure 7
Nutrient response of diatom-specific cyclins. (a) Growth rate of different subcultures after repletion based on average cell density measurements at the time of and 3 days after repletion. These data indicate the ability of the cells to recover from starvation. (b) Expression profiles of early cell cycle genes at the time of sampling during the light experiment. (c) Expression profiles of early cell cycle genes at the time of sampling during the dark experiment. (d) dsCYCs responding to phosphate addition. Error bars represent standard errors of the mean of two biological replicates.
Figure 8
Figure 8
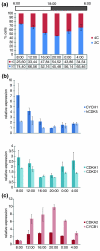
Validation of cell cycle marker genes. (a) DNA distributions (2C versus 4C) of exponentially growing cells entrained by a LD 12:12 photoperiod during the time series (b) Expression profiles of early cell cycle genes (CYCH1 and hCDK5; peak expression at t = 2 in the synchronization series (Figure 4 and 6)); and CDKA1 and CDKD1 (peak expression at t = 3 in the synchronization series (Figure 4)). (c) Expression profiles of late cell cycle genes (CDKA2 and CYCB1). Error bars represent standard errors of the mean of two biological replicates.

Similar articles

Cited by

References

    1. Hoek C Van den, Mann DG, Jahns HM. Algae: An Introduction to Phycology. Cambridge: Cambridge University Press; 1995.
    1. Field CB, Behrenfeld MJ, Randerson JT, Falkowski P. Primary production of the biosphere: integrating terrestrial and oceanic components. Science. 1998;281:237–240. doi: 10.1126/science.281.5374.237. - DOI - PubMed
    1. Kooistra WH, De Stefano M, Mann DG, Medlin LK. The phylogeny of the diatoms. Prog Mol Subcell Biol. 2003;33:59–97. - PubMed
    1. Li S, Nosenko T, Hackett JD, Bhattacharya D. Phylogenomic analysis identifies red algal genes of endosymbiotic origin in the chromalveolates. Mol Biol Evol. 2006;23:663–674. doi: 10.1093/molbev/msj075. - DOI - PubMed
    1. Armbrust EV, Berges JA, Bowler C, Green BR, Martinez D, Putnam NH, Zhou SG, Allen AE, Apt KE, Bechner M, Brzezinski MA, Chaal BK, Chiovitti A, Davis AK, Demarest MS, Detter JC, Glavina T, Goodstein D, Hadi MZ, Hellsten U, Hildebrand M, Jenkins BD, Jurka J, Kapitonov VV, Kröger N, Lau WWY, Lane TW, Larimer FW, Lippmeier JC, Lucas S. The genome of the diatom Thalassiosira pseudonana: Ecology, evolution, and metabolism. Science. 2004;306:79–86. doi: 10.1126/science.1101156. - DOI - PubMed

Publication types

LinkOut - more resources