. 2010 Apr 16;285(16):12367-77.
doi: 10.1074/jbc.M109.083527. Epub 2010 Feb 9.

Structural basis for the growth factor activity of human adenosine deaminase ADA2

Affiliations

Structural basis for the growth factor activity of human adenosine deaminase ADA2

Anton V Zavialov et al. J Biol Chem. .

Abstract

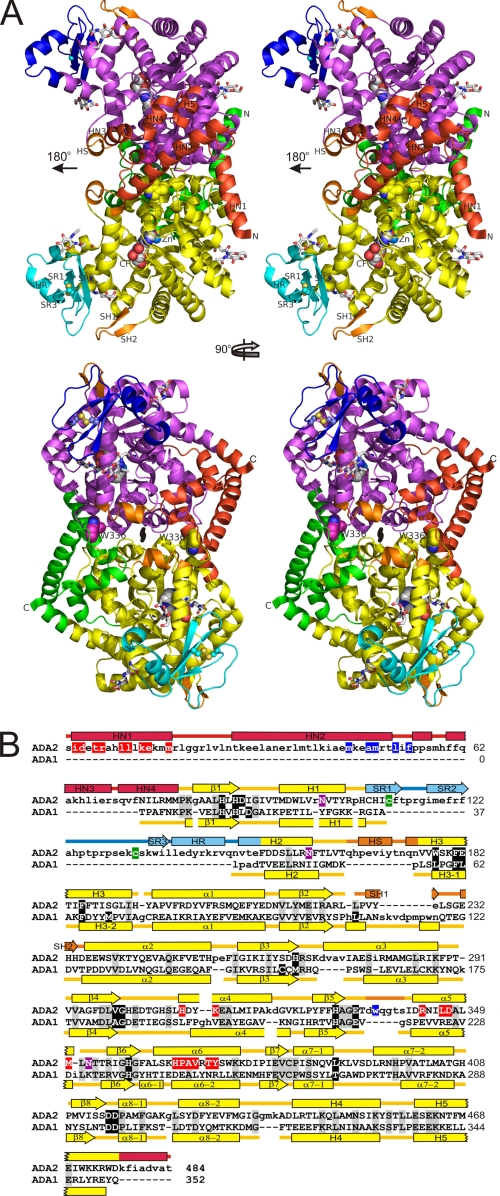
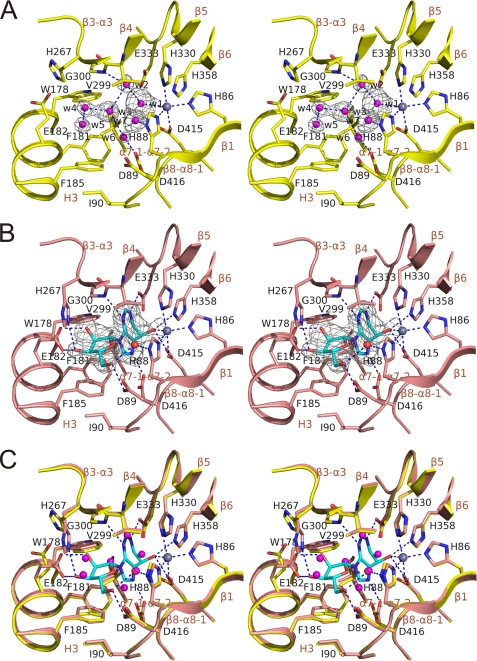
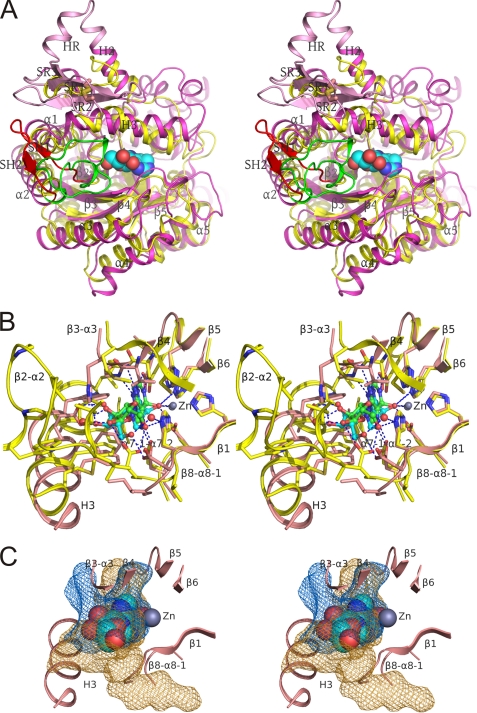
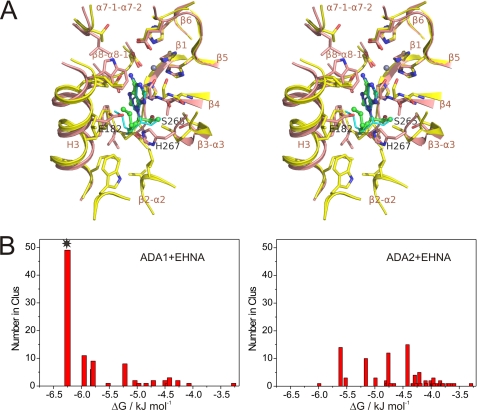
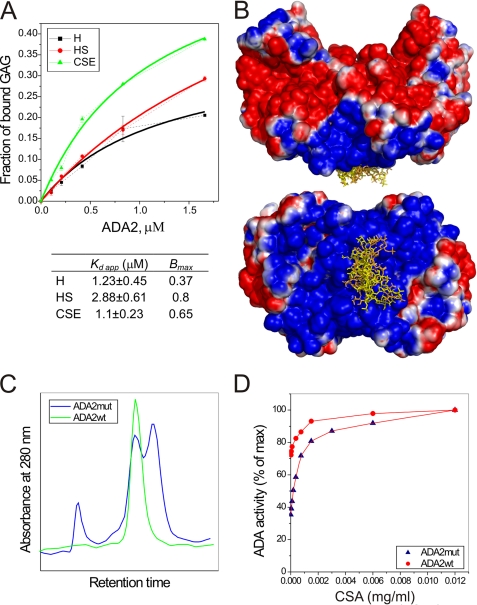
Two distinct adenosine deaminases, ADA1 and ADA2, are found in humans. ADA1 has an important role in lymphocyte function and inherited mutations in ADA1 result in severe combined immunodeficiency. The recently isolated ADA2 belongs to the novel family of adenosine deaminase growth factors (ADGFs), which play an important role in tissue development. The crystal structures of ADA2 and ADA2 bound to a transition state analogue presented here reveal the structural basis of the catalytic/signaling activity of ADGF/ADA2 proteins. In addition to the catalytic domain, the structures discovered two ADGF/ADA2-specific domains of novel folds that mediate the protein dimerization and binding to the cell surface receptors. This complex architecture is in sharp contrast with that of monomeric single domain ADA1. An extensive glycosylation and the presence of a conserved disulfide bond and a signal peptide in ADA2 strongly suggest that ADA2, in contrast to ADA1, is specifically designed to act in the extracellular environment. The comparison of catalytic sites of ADA2 and ADA1 demonstrates large differences in the arrangement of the substrate-binding pockets. These structural differences explain the substrate and inhibitor specificity of adenosine deaminases and provide the basis for a rational design of ADA2-targeting drugs to modulate the immune system responses in pathophysiological conditions.


Figures

FIGURE 1.
FIGURE 1.
Structure of human ADA2. A, ribbon diagram of the ADA2 dimer (stereo view). “Butterfly” view of the molecule (top) and molecule rotated 90° around vertical axis toward the viewer (below). The ADA, dimerization, and PRB domains are shown in yellow, green, and cyan in one subunit and in magenta, red, and blue in the second subunit, respectively. Small unique elements are painted in orange. Catalytic Zn2+, coformycin molecules bound in the active sites, and Trp-336 are shown as spheres. Asparagine-linked N-acetyl glucosamine as well as the disulfide in PRB domains are shown with sticks. Oxygen, nitrogen, and sulfur atoms are painted in red, blue, and yellow, respectively, whereas carbon atoms are colored in white, green, yellow, or magenta. Secondary structure elements unique for ADA2 segments are labeled. The local two-fold symmetry axis is indicated. B, structural alignment of human ADA2 and mouse ADA1 (PDB accession code 2ADA). Structurally equivalent and nonequivalent residues are shown in upper and lower cases, respectively. Amino acid identities are indicated by background shading in gray. Active site residues are shown on the black background. Residues involved in the helix anchor and tryptophan catch intersubunit contacts are shown on red and blue backgrounds, respectively. The disulfide bond-linked cysteines and glycosylated asparagines are indicated by background shading in green and magenta, respectively. Secondary structure (rectangle, α-helix; arrow, β-strand; line, coil) is shown above and below the amino acid sequence of ADA2 and ADA1, respectively. The ADA domains of ADA2 and ADA1 are painted in yellow; ADA2 dimerization and PRB domains and small unique elements are painted in red, blue, and orange, respectively.
FIGURE 2.
FIGURE 2.
ADA2 dimerization contacts: HN1 helix anchor (A) and Trp-336 catch (B). Helix HN1 (A) and helix HN2 and loop HN2-HN3 (B) of one subunit are shown as a cartoon in red. The second subunit is represented by molecular surface colored by type of element (A) or schematic (loop β5-α5) in yellow (B). Interactive side chains in the first subunit are shown as balls and sticks. Trp-336 in the second subunit is shown as spheres. Oxygen and nitrogen atoms are painted in red and yellow, respectively, whereas carbon atoms are colored in green, yellow, or white.
FIGURE 3.
FIGURE 3.
Active site of ADA2 with and without coformycin (stereo views). A, ligand-free active site. B, ADA2 complexed with coformycin. C, superposition of active site residues of nonligated ADA2 (A) and ADA2 complexed with coformycin (B). The main chain is shown as a schematic painted in yellow and pink for nonligated and complexed ADA2, respectively. Side chains of the active site residues are shown with sticks and colored by the type of element. Oxygen and nitrogen atoms are also shown in red and blue, respectively. Carbon atoms in the nonligated and complexed ADA2 and coformycin are shown in yellow, pink, and cyan, respectively. Active site water molecules are shown as spheres and painted in magenta and red in the structures of ligand-free ADA2 and ADA2-CF complex, respectively. Zn2+ ion is shown as a gray sphere. (2|Fo| − |Fc|, αc) density for water molecules in A and coformycin in B is shown as a gray mesh at a contour level of 1 σ. Dashed lines represent coordinating interactions with zinc as well as hydrogen bonds between coformycin, active site water molecules, and ADA2. Active site residues, water molecules, and elements of secondary structure are labeled.
FIGURE 4.
FIGURE 4.
Comparison of the active site in ADA2 and ADA1. A, superposition of structures of human ADA2 and mouse ADA1 (PDB accession code 2ADA) (cartoon diagrams, stereo view). ADA2 is painted in magenta except for the putative receptor-binding domain (pink) and SH1-SH2 hairpin (red). ADA1 is painted in yellow except for loop β2-α2 (green). The Cys-111–Cys-133 disulfide bond is shown with sticks. The coformycin molecule in the ADA2 catalytic site is shown as spheres. B, superposition of active site residues in human ADA2 and mouse ADA1 complexed with coformycin and HDPR, respectively (stereo view). The main chain is shown as a schematic painted in pink and yellow for ADA2 and ADA1, respectively. Side chains of the active site residues are shown with sticks and colored by the type of element. Carbon atoms in ADA2, ADA1, coformycin, and HDPR are shown in pink, yellow, cyan, and green, respectively. Atoms of oxygen and nitrogen are painted in red and blue, respectively, in all structures. Zinc atom and water molecules in contact with ligands are shown as spheres in gray and red, respectively. ADA2 is shown in the same orientation as in Fig. 3. Dashed lines represent hydrogen bonds between ligands and proteins and zinc coordination by ligands. C, the catalytic site of ADA2 is more open than that in ADA1. Cavities in the active sites of ADA2 and ADA1 (which were superimposed and displayed in the same orientation as that in B) are shown with mesh in orange and blue colors, respectively. For clarity only the ribbon diagrams of the ADA2 active site and ADA2 complexed with the coformycin molecule are shown. In A–C, structures were superimposed by distance minimization between Cα atoms of invariant catalytic residues.
FIGURE 5.
FIGURE 5.
Structural basis of selective binding of EHNA to ADA1 but not ADA2. A, structural superposition of the active sites of crystal structures of human ADA2 and bovine ADA1-EHNA complex (PDB accession code 2Z7G) and the low energy ADA1-EHNA complex obtained by docking of EHNA to the ADA1 structure (see bellow). The main chain is shown as a cartoon painted in pink and yellow for ADA2 and ADA1, respectively. Side chains of the active site residues are shown with sticks and colored by type of element. Carbon atoms in ADA2, ADA1, EHNA (crystal), and EHNA (docking experiment) are shown in pink, yellow, green, and cyan, respectively. Atoms of oxygen and nitrogen are painted in red and blue, respectively, in all structures. Zinc atoms are shown as spheres in gray. Secondary structure elements and Glu-182, His-267, and Ser-265 are labeled. Structures were superimposed by distance minimization between Cα atoms of the invariant active site residues and zinc ions. B, the binding energy statistic histograms of complexes between EHNA and bovine ADA1 (left) and human ADA2 (right) obtained from docking experiments using AutoDock 4 and AutoDockTools version 1.4.5. Note that although the majority of the predicted complexes between ADA1 and EHNA (marked by a star) have similar low energy structures that are very close to the crystal structure of the bovine ADA1-EHNA complex, no dominant low energy complexes are predicted for ADA2. Number in Clus, number in clusters.
FIGURE 6.
FIGURE 6.
ADA2 interaction with GAGs. A, equilibrium binding of ADA2 to heparin (black), HS (red), and chondroitin sulfate E (CSE) (green). Approximately 0.2 μg of intact 3H-labeled GAGs were incubated with increasing concentrations of ADA2 for 2 h at 37 °C. Error bars indicate S.D. B, heparin-binding site on ADA2 as determined by docking model ligands. A pentasaccharide ligand consisting of 3 GlcNS6S residues separated by IdoA2S residues was used in the docking study. In one version (yellow), all IdoA2S residues are in the 1C4 ring conformation, whereas in another (orange), these residues are in 2S0 ring conformation. The four lowest energy complexes between ADA2 and each of the ligands are shown overlaid. Solvent-accessible surface of ADA2 is shown with the electrostatic potential of the ADA2 molecule (from −1 to 1 kiloteslas) mapped onto it. Note that ligands bind in the positively charged area located in the region between two subunits of the ADA2 dimer. C and D, a point mutation in the intersubunit space of ADA2 facilitates dissociation of ADA2 into monomers and decreases the ADA activity. C, T336G mutant of ADA2 (ADA2mut) dissociates into monomers under denaturing conditions. Elution profiles of gel filtration of wild type and mutant ADA2 on a Superdex 200 column in the presence of 2 m urea are shown in green and blue, respectively. D, binding of GAGs to ADA2 increases the ADA activity. The activity of ADA2 wild type and ADA2 T336G mutant has been determined in the presence of increasing concentrations of chondroitin sulfate A (CSA).

References

    1. Haskó G., Linden J., Cronstein B., Pacher P. (2008) Nat. Rev. Drug. Discov. 7, 759–770 - PMC - PubMed
    1. Maier S. A., Galellis J. R., McDermid H. E. (2005) J. Mol. Evol. 61, 776–794 - PubMed
    1. Zurovec M., Dolezal T., Gazi M., Pavlova E., Bryant P. J. (2002) Proc. Natl. Acad. Sci. U.S.A. 99, 4403–4408 - PMC - PubMed
    1. Hershfield M. S. (2005) Eur. J. Immunol. 35, 25–30 - PubMed
    1. Dillman R. O. (2004) Expert. Rev. Anticancer Ther. 4, 27–36 - PubMed

Publication types

MeSH terms