. 2010 Jul 6;7(48):1119-27.
doi: 10.1098/rsif.2009.0530. Epub 2010 Feb 10.

Protocols for sampling viral sequences to study epidemic dynamics

Affiliations

Protocols for sampling viral sequences to study epidemic dynamics

J Conrad Stack et al. J R Soc Interface. .

Abstract

With more emphasis being put on global infectious disease monitoring, viral genetic data are being collected at an astounding rate, both within and without the context of a long-term disease surveillance plan. Concurrent with this increase have come improvements to the sophisticated and generalized statistical techniques used for extracting population-level information from genetic sequence data. However, little research has been done on how the collection of these viral sequence data can or does affect the efficacy of the phylogenetic algorithms used to analyse and interpret them. In this study, we use epidemic simulations to consider how the collection of viral sequence data clarifies or distorts the picture, provided by the phylogenetic algorithms, of the underlying population dynamics of the simulated viral infection over many epidemic cycles. We find that sampling protocols purposefully designed to capture sequences at specific points in the epidemic cycle, such as is done for seasonal influenza surveillance, lead to a significantly better view of the underlying population dynamics than do less-focused collection protocols. Our results suggest that the temporal distribution of samples can have a significant effect on what can be inferred from genetic data, and thus highlight the importance of considering this distribution when designing or evaluating protocols and analysing the data collected thereunder.


Figures
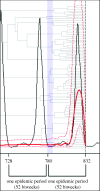
Figure 1.
Figure 1.
The thin black curve shows the population dynamics of the TSIR model or the actual time series. The thick red curve shows an estimation of the actual time series as inferred by BEAST, with the two dotted red lines above and below representing the 95% confidence interval. The grey binary tree is the actual genealogy relating the sequences used in the BEAST reconstruction. The sequences themselves are from a short-term point sample analysis of 100 samples collected from generation 832. Note that the BEAST estimate (the skyline plot) does not project accurately past the population bottleneck (indicated by the blue-shaded region) and that most of the lineages in the tree have coalesced by that point. When reading the tree right to left, branch lengths are long during the epidemic phase—indicating population expansion—and then rapidly begin to coalesce—indicating a sharp contraction in the number of infecteds, and thus the bottleneck (electronic supplementary material, figure S1).
Figure 2.
Figure 2.
Examples of the four sampling protocols described in §2. The thin black curves show the TSIR time series and the thick red curves show example BEAST reconstructions. The thick vertical lines on the x-axis show the relative number of sequences taken at that generation. In this example, 400 samples were taken under each protocol (long term). (a) Point sampling, (b) fuzzy sampling, (c) serial sampling and (d) convenience sampling.
Figure 3.
Figure 3.
Point sampling analyses (§2), each consisting of 100 samples, were done for every generation between 781 and 886. The solid black line is the true time series. The solid red line shows the mean SSD values between the BEAST posterior reconstruction and the TSIR time series as a function of generation. The dotted red lines indicate the upper and lower 95% posterior density SSD values for each generation. Note that the SSD value drops significantly when samples are collected from the region immediately following a major epidemic (see electronic supplementary material, table S1, for more information).
Figure 4.
Figure 4.
(a) Comparison between fuzzy and point sampling and (b) serial and convenience sampling. (a) Range of normalized SSD values (calculated between skyline plot means and the actual time series only) above the regions of the epidemic curve (electronic supplementary material, figure S3) they represent. The faint grey line shows which region the point and fuzzy sampling sets came from. Letters a–f above each region have been included for ease of reference. (b) For comparison, the normalized SSD values (means) for aggregated serial and convenience sampling analyses. Point and fuzzy sampling offers no real advantage over serial and convenience sampling except when point and fuzzy samples are taken exclusively from the regions following the peak of a major epidemic.

References

    1. Bjornstad O. N., Finkenstadt B. F., Grenfell B. T. 2002. Dynamics of measles epidemics: estimating scaling of transmission rates using a time series SIR model. Ecol. Monogr. 72, 169–184.
    1. Bolker B., Grenfell B. 1995. Space, persistence and dynamics of measles epidemics. Phil. Trans. R. Soc. Lond. B 348, 309–320. (10.1098/rstb.1995.0070) - DOI - PubMed
    1. Drummond A. J., Rambaut A. 2007. BEAST: Bayesian evolutionary analysis by sampling trees. BMC Evol. Biol. 7, 214 (10.1186/1471-2148-7-214) - DOI - PMC - PubMed
    1. Drummond A. J., Rambaut A., Shapiro B., Pybus O. G. 2005. Bayesian coalescent inference of past population dynamics from molecular sequences. Mol. Biol. Evol. 22, 1185–1192. (10.1093/molbev/msi103) - DOI - PubMed
    1. Earn D. J., Rohani P., Bolker B. M., Grenfell B. T. 2000. A simple model for complex dynamical transitions in epidemics. Science 287, 667–670. (10.1126/science.287.5453.667) - DOI - PubMed

Publication types

LinkOut - more resources