

Heterogeneity in chronic myeloid leukaemia dynamics during imatinib treatment: role of immune responses
- PMID: 20147328
- PMCID: PMC2871874
- DOI: 10.1098/rspb.2009.2179
Heterogeneity in chronic myeloid leukaemia dynamics during imatinib treatment: role of immune responses
Abstract
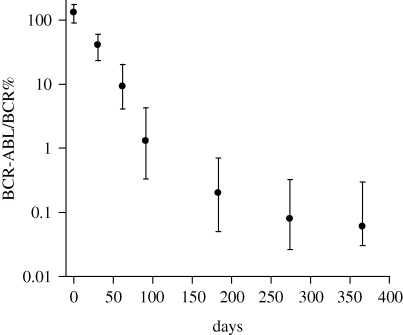
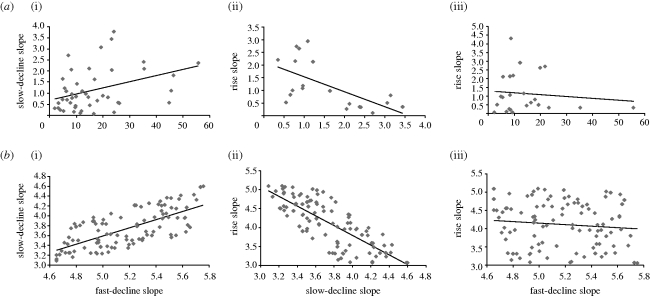
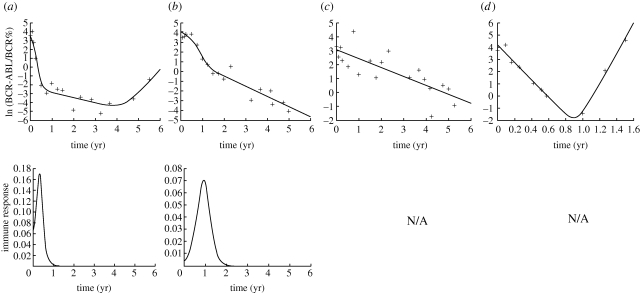
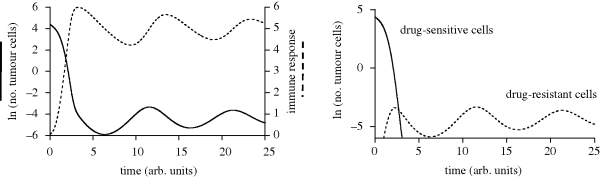
Previous studies have shown that during imatinib therapy, the decline of chronic myeloid leukaemia BCR-ABL transcript numbers involves a fast phase followed by a slow phase in averaged datasets. Drug resistance leads to regrowth. In this paper, variation of treatment responses between patients is examined. A significant positive correlation is found between slopes of the fast and the slow phase of decline. A significant negative correlation is found between slopes of the slow phase of decline and the regrowth phase. No correlation is found between slopes of the fast phase of decline and the regrowth phase. A mathematical model that is successfully fitted to diverse clinical profiles explains these correlations by invoking the immune response as a key determinant of tumour decline during treatment. Boosting immunity during drug therapy could enhance the response to treatment in patients.
Figures
Similar articles
-
Imatinib mesylate in the treatment of chronic myeloid leukaemia.Expert Opin Pharmacother. 2003 Jun;4(6):963-71. doi: 10.1517/14656566.4.6.963. Expert Opin Pharmacother. 2003. PMID: 12783592 Review.
-
Imatinib for chronic myeloid leukaemia: a NICE mess.Lancet. 2001 Nov 3;358(9292):1478. doi: 10.1016/S0140-6736(01)06571-0. Lancet. 2001. PMID: 11705557 No abstract available.
-
Position paper on imatinib mesylate in chronic myeloid leukaemia.Br J Haematol. 2002 Oct;119(1):268-72. doi: 10.1046/j.1365-2141.2002.39201.x. Br J Haematol. 2002. PMID: 12358935 No abstract available.
-
Concomitant myelodysplastic syndrome and chronic myeloid leukaemia: treatment outcomes with imatinib mesylate.Br J Haematol. 2003 Oct;123(2):366-7. doi: 10.1046/j.1365-2141.2003.04607.x. Br J Haematol. 2003. PMID: 14531922 No abstract available.
-
STI-571 in chronic myelogenous leukaemia.Br J Haematol. 2002 Oct;119(1):15-24. doi: 10.1046/j.1365-2141.2002.03899.x. Br J Haematol. 2002. PMID: 12358949 Review. No abstract available.
Cited by
-
Predictive biomarkers: a paradigm shift towards personalized cancer medicine.Nat Rev Clin Oncol. 2011 Aug 23;8(10):587-96. doi: 10.1038/nrclinonc.2011.121. Nat Rev Clin Oncol. 2011. PMID: 21862978 Review.
-
Rapid initial decline in BCR-ABL1 is associated with superior responses to second-line nilotinib in patients with chronic-phase chronic myeloid leukemia.BMC Cancer. 2013 Apr 2;13:173. doi: 10.1186/1471-2407-13-173. BMC Cancer. 2013. PMID: 23547655 Free PMC article.
-
Quantitative prediction of long-term molecular response in TKI-treated CML - Lessons from an imatinib versus dasatinib comparison.Sci Rep. 2018 Aug 17;8(1):12330. doi: 10.1038/s41598-018-29923-4. Sci Rep. 2018. PMID: 30120281 Free PMC article.
References
-
- Barnes E., Harcourt G., Brown D., Lucas M., Phillips R., Dusheiko G., Klenerman P.2002The dynamics of T-lymphocyte responses during combination therapy for chronic hepatitis C virus infection. Hepatology 36, 743–754 (doi:10.1053/jhep.2002.35344) - DOI - PubMed
-
- Bradeen H. A., Eide C. A., O'Hare T., Johnson K. J., Willis S. G., Lee F. Y., Druker B. J., Deininger M. W.2006Comparison of imatinib mesylate, dasatinib (BMS-354825), and nilotinib (AMN107) in an N-ethyl-N-nitrosourea (ENU)-based mutagenesis screen: high efficacy of drug combinations. Blood 108, 2332–2338 (doi:10.1182/blood-2006-02-004580) - DOI - PMC - PubMed
-
- Calabretta B., Perrotti D.2004The biology of CML blast crisis. Blood 103, 4010–4022 (doi:10.1182/blood-2003-12-4111) - DOI - PubMed
-
- Chen C. I., Maecker H. T., Lee P. P.2008Development and dynamics of robust T-cell responses to CML under imatinib treatment. Blood 111, 5342–5349 (doi:10.1182/blood-2007-12-128397) - DOI - PMC - PubMed
-
- Deininger M. W.2007Optimizing therapy of chronic myeloid leukemia. Exp. Hematol. 35, 144–154 (doi:10.1016/j.exphem.2007.01.023) - DOI - PubMed
Publication types
MeSH terms
Substances
Grants and funding
LinkOut - more resources
Full Text Sources
Medical
Miscellaneous
