. 2010 Apr;84(8):3935-48.
doi: 10.1128/JVI.02467-09. Epub 2010 Feb 10.

Lentiviral Nef proteins utilize PAK2-mediated deregulation of cofilin as a general strategy to interfere with actin remodeling

Affiliations

Lentiviral Nef proteins utilize PAK2-mediated deregulation of cofilin as a general strategy to interfere with actin remodeling

Bettina Stolp et al. J Virol. 2010 Apr.

Abstract

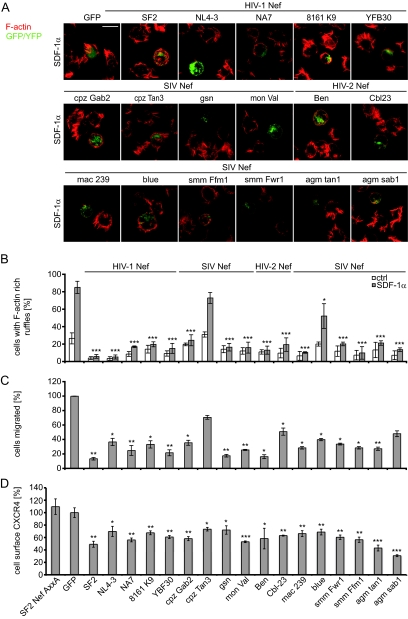
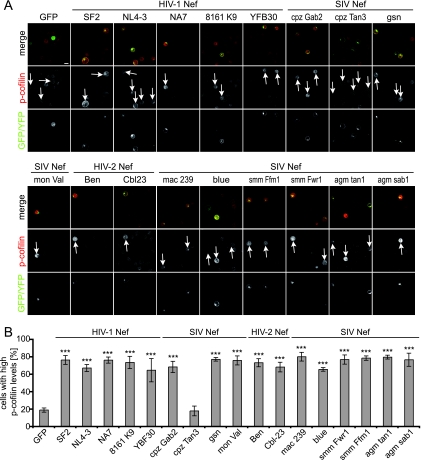
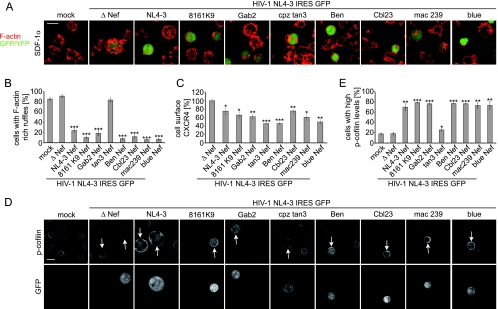
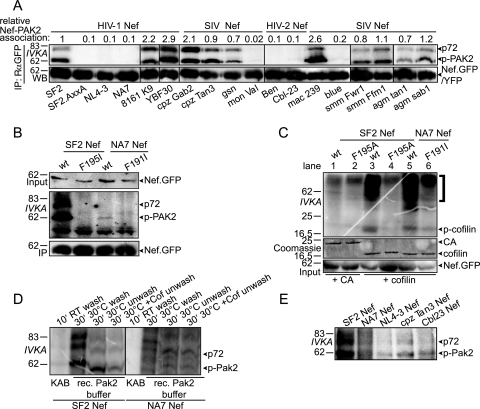
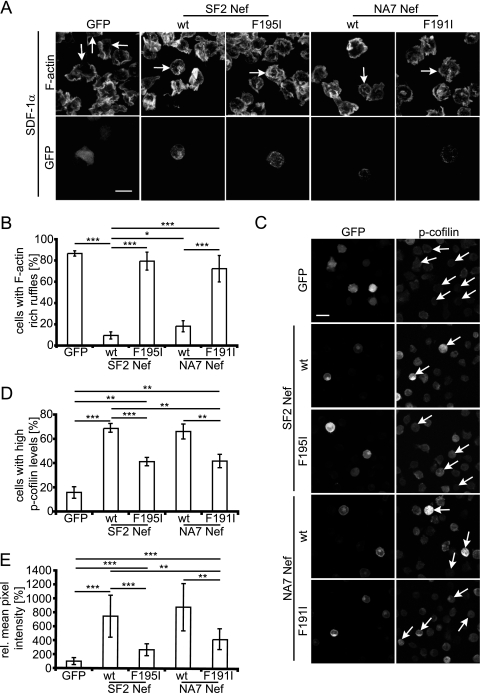
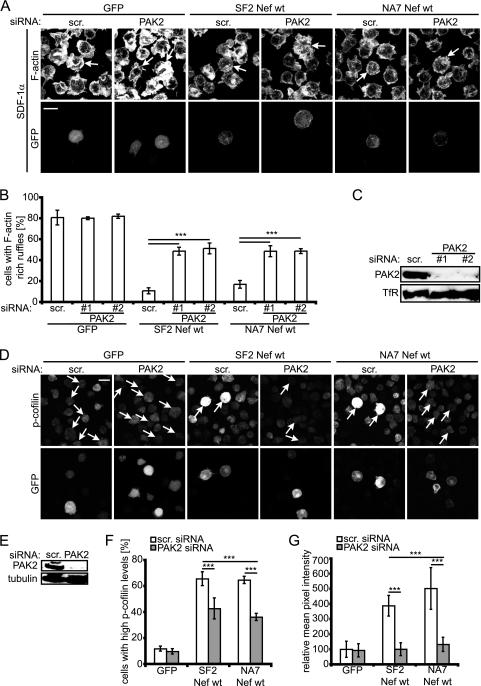
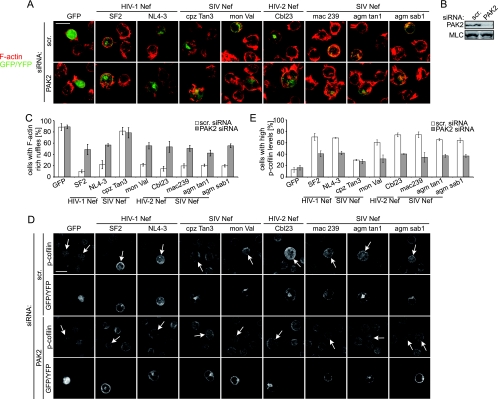
Nef is an accessory protein and pathogenicity factor of human immunodeficiency virus (HIV) and simian immunodeficiency virus (SIV) which elevates virus replication in vivo. We recently described for HIV type 1(SF2) (HIV-1(SF2)) the potent interference of Nef with T-lymphocyte chemotaxis via its association with the cellular kinase PAK2. Mechanistic analysis revealed that this interaction results in deregulation of the actin-severing factor cofilin and thus blocks the chemokine-mediated actin remodeling required for cell motility. However, the efficiency of PAK2 association is highly variable among Nef proteins from different lentiviruses, prompting us to evaluate the conservation of this actin-remodeling/cofilin-deregulating mechanism. Based on the analysis of a total of 17 HIV-1, HIV-2, and SIV Nef proteins, we report here that inhibition of chemokine-induced actin remodeling as well as inactivation of cofilin are strongly conserved activities of lentiviral Nef proteins. Of note, even for Nef variants that display only marginal PAK2 association in vitro, these activities require the integrity of a PAK2 recruitment motif and the presence of endogenous PAK2. Thus, reduced in vitro affinity to PAK2 does not indicate limited functionality of Nef-PAK2 complexes in intact HIV-1 host cells. These results establish hijacking of PAK2 for deregulation of cofilin and inhibition of triggered actin remodeling as a highly conserved function of lentiviral Nef proteins, supporting the notion that PAK2 association may be critical for Nef's activity in vivo.


Figures

FIG. 1.
FIG. 1.
Inhibition of chemokine-induced membrane ruffling and chemotaxis is a conserved feature of lentiviral Nef proteins. (A) SDF-1α-induced actin ruffle formation is inhibited by various nef alleles. Representative micrographs of Jurkat T lymphocytes (Jurkat CCR7) transiently expressing the indicated GFP- or YFP-fused Nef proteins were fixed 20 min after treatment with 200 ng/ml SDF-1α and stained for F-actin. For representative micrographs of control cells treated with medium instead of SDF-1α, see Fig. S2 in the supplemental material. Shown are merge pictures of the GFP/YFP and F-actin channel. Scale bar = 10 μm. (B) Frequency of the cells shown in panel A that display membrane ruffling in response to treatment with SDF-1α or a medium control (ctrl). Depicted are mean values from three independent experiments ± standard deviations (SD) with at least 100 cells analyzed per condition. P values were calculated relative to the GFP control. (C) Chemotaxis toward SDF-1α is inhibited by various nef alleles. The cells shown in panel A were subjected to a transwell chemotaxis assay. Depicted is the percentage of GFP-positive cells that migrated toward 10 ng/ml SDF-1α over 2 h. Values are the means with standard errors of the means (SEM) from three experiments performed in triplicate. (D) CXCR4 is downregulated from the cell surface by various nef alleles. The cells shown in panel A were stained for cell surface CXCR4 and analyzed by flow cytometry. Shown are mean values from three experiments ± SD, with 5,000 GFP- or YFP-positive cells analyzed in each experiment. ***, P < 0.0005; **, P < 0.005; *, P < 0.05.
FIG. 2.
FIG. 2.
Induction of cofilin hyperphosphorylation is a conserved feature of lentiviral Nef proteins. (A) Representative micrographs of Jurkat T lymphocytes (Jurkat TAg) transiently expressing the indicated GFP- or YFP-fused Nef proteins. Cells were plated onto cover glasses, fixed, and stained for p-cofilin. Identical fields of view are shown for GFP/YFP, p-cofilin, and merge channels. Arrows indicate GFP/YFP positive cells. Scale bar = 10 μm. (B) Frequency of the cells shown in panel A with high p-cofilin levels. Depicted are mean values from three independent experiments ± SD, with at least 100 cells analyzed per transfection; cells were scored as containing high p-cofilin levels when they were visibly brighter than untransfected neighboring cells. P values are calculated relative to the GFP control.
FIG. 3.
FIG. 3.
Various Nef variants inhibit membrane ruffle formation and induce cofilin hyperphosphorylation in the context of an HIV-1 infection. (A) Representative maximum projections of confocal Z stacks of Jurkat T lymphocytes (Jurkat-CCR7) infected with HIV-1NL4-3 IRES GFP carrying the indicated nef alleles in its nef gene locus or its nef-deleted counterpart (ΔNef). At 48 h postinfection, cells were treated with 200 ng/ml SDF-1α for 20 min, fixed, and stained for F-actin. Infected cells appear green due to IRES-driven GFP expression. Shown are merge pictures of the GFP and F-actin channels. Scale bar = 10 μm. (B) Frequency of cells shown in panel A with membrane ruffles. Depicted are mean values from three experiments ± SD, with at least 100 cells analyzed per condition. P values are calculated relative to HIV-1ΔNef-infected cells. (C) CXCR4 is downregulated from the cell surface by all nef alleles. The cells shown in panel A were stained for cell surface CXCR4 and analyzed by flow cytometry. Shown are mean values from three experiments ± SD, with 5,000 GFP-positive cells analyzed in each experiment. (D) Cofilin deregulation in HIV-1 infection. Representative confocal micrographs of Jurkat T lymphocytes (Jurkat-CCR7) infected with HIV-1NL4-3 IRES GFP carrying the indicated nef alleles in its nef gene locus or its nef-deleted counterpart. At 48 h postinfection, cells were seeded onto cover glasses, fixed, and stained for p-cofilin. Infected cells appear green due to IRES-driven GFP expression and are indicated by arrows. Scale bar = 10 μm. The p-cofilin and GFP panels show identical fields of view. (E) Frequency of cells shown in panel D with high p-cofilin levels. Depicted are mean values from three experiments ± SD, with at least 100 cells analyzed per condition. Cells were scored as containing high p-cofilin levels when they were visibly brighter than uninfected neighboring cells.
FIG. 4.
FIG. 4.
Nef-PAK2 association in vitro for lentiviral Nef proteins. (A to E) Jurkat T lymphocytes (Jurkat TAg) expressing the indicated GFP- or YFP-fused Nef proteins were subjected to anti-GFP immunoprecipitation and subsequent in vitro kinase assay (IVKA). Nef-associated PAK2 activity is revealed by the phosphorylated 62-kDa band (IVKA, p-PAK2). (A) Characterization of Nef proteins analyzed in Fig. 1 and 2 in IVKA. Nef-PAK2 association was quantified relative to that of SF2 Nef (arbitrarily set to 1). Shown are results representative of those of three independent experiments in which wt SF2Nef and SF2NefAxxA were always included as positive and negative control, respectively. (B) Nef-PAK2 association depends on F195/191. By increasing the incubation time of the IVKA to 10 min, weak but F191-specific Nef-PAK2 association can be detected for NA7 Nef. (C) SF2 and NA7 Nef-associated PAK2 can phosphorylate cofilin. IVKA was performed using recombinant PAK2 buffer for 30 min at 30°C in the presence of recombinant cofilin or HIV-1 CA as substrate, and phosphorylated proteins were detected by autoradiography. Input levels of Nef, recombinant cofilin, and p24CA were detected by Western blotting and Coomassie staining, respectively. p-cofilin designates phosphorylated cofilin, and the bracket indicates high-molecular-weight phosphoproducts. (D) Optimization of kinase assay conditions to allow detection of a kinase signal for weakly PAK2-associating Nefs. IVKA conditions for every lane are indicated. (E) Weak association of all Nefs with PAK2 activity can be detected by performing the IVKA reaction in recombinant PAK2 buffer for 30 min at 30°C without subsequent washing.
FIG. 5.
FIG. 5.
NA7 Nef blocks actin remodeling and induces cofilin hyperphosphorylation in an F191-dependent manner. (A) Representative micrographs of Jurkat T lymphocytes (Jurkat CCR7) transiently expressing the indicated GFP-fused wt or F195/191I Nef proteins were fixed 20 min after treatment with 200 ng/ml SDF-1α and stained for F-actin. Scale bar = 10 μm. F-actin and GFP panels show identical fields of view. Arrows indicate GFP-positive cells. (B) Frequency of the cells shown in panel A that display membrane ruffling in response to treatment with SDF-1α. Depicted are mean values from three independent experiments ± SD, with at least 100 cells analyzed per condition. (C) Representative sum-intensity projections of confocal Z stacks of Jurkat T lymphocytes (Jurkat TAg) transiently expressing the indicated GFP-fused wt or F195/191I Nef proteins. Cells were plated onto cover glasses, fixed, and stained for p-cofilin. Scale bar = 10 μm. p-cofilin and GFP panels show identical fields of view. Arrows indicate GFP-positive cells. (D) Frequency of the cells shown in panel C with high p-cofilin levels. Depicted are mean values from three independent experiments ± SD, with at least 100 cells analyzed per transfection; cells were scored as containing high p-cofilin levels when they were visibly brighter than untransfected neighboring cells. (E) Relative mean pixel intensity of the cells shown in panel C. Depicted are mean values ± SD from at least 10 representative cells.
FIG. 6.
FIG. 6.
Inhibition of actin remodeling and induction of cofilin hyperphosphorylation are dependent on the Nef phenylalanine motif in the context of HIV-1 infection. (A) Representative maximum projections of confocal Z stacks of PBLs infected with HIV-1NL4-3 encoding wt SF2 or NA7 Nef or their F195/191I mutants or its nef-deleted counterpart (ΔNef). Cells were treated with 200 ng/ml SDF-1α, CCL-19, or CCL-21 for 20 min, fixed, and stained for intracellular p24CA and F-actin. The arrows indicate infected cells. Scale bar = 10 μm. (B) Frequency of cells shown in panel A with membrane ruffles. Depicted are mean values from triplicate infections ± SD for two independent donors with at least 100 cells analyzed per condition. (C) Representative confocal micrographs of PBLs infected with HIV-1NL4-3 carrying either wt SF2 or NA7 Nef or their F195/191I mutants or its nef-deleted counterpart (ΔNef). Cells were seeded onto cover glasses, fixed, and stained for p24CA and p-cofilin. The arrows indicate infected cells. Scale bar = 10 μm. (D) Frequency of cells shown in panel C with high p-cofilin levels. Depicted are mean values from triplicate infections ± SD for two independent donors, with at least 100 cells analyzed per condition; cells were scored as containing high p-cofilin levels when they were visibly brighter than uninfected neighboring cells. P values are calculated relative to results for HIV-1ΔNef-infected cells.
FIG. 7.
FIG. 7.
Inhibition of membrane ruffle formation and induction of cofilin hyperphosphorylation by SF2 and NA7 Nef are similarly dependent on PAK2 expression. (A) Representative micrographs of Jurkat T lymphocytes (Jurkat CCR7) transfected with siRNA oligonucleotides specific for PAK2 or a nonspecific scrambled siRNA (scr.) together with expression plasmids for GFP or wt SF2/NA7 Nef.GFP. Cells were fixed 20 min after treatment with 200 ng/ml SDF-1α and stained for F-actin. Scale bar = 10 μm. F-actin and GFP panels show identical fields of view. Arrows indicate GFP-positive cells. (B) Frequency of the cells shown in panel A that display membrane ruffling in response to treatment with SDF-1α. Depicted are mean values from three independent experiments ± SD, with at least 100 cells analyzed per condition. (C) Western blot analysis of lysates of the cells used in panel A. TfR, transferrin receptor as loading control. (D) Representative sum-intensity projections of confocal Z stacks of Jurkat T lymphocytes (Jurkat TAg) transfected with siRNA oligonucleotides specific for PAK2 or a nonspecific scrambled siRNA (scr.) together with expression plasmids for GFP or wt SF2/NA7 Nef.GFP. Cells were plated onto cover glasses, fixed, and stained for p-cofilin. Scale bar = 10 μm. p-cofilin and GFP panels show identical fields of view. Arrows indicate GFP-positive cells. (E) Western blot analysis of lysates of the cells used in panel D. (F) Frequency of the cells shown in panel D with high p-cofilin levels. Depicted are mean values from three independent experiments ± SD, with at least 100 cells analyzed per transfection; cells were scored as containing high p-cofilin levels when they were visibly brighter than untransfected neighboring cells. (G) Relative mean pixel intensity of the cells shown in panel D. Depicted are mean values ± SD from at least 10 representative cells.
FIG. 8.
FIG. 8.
PAK2 dependency of actin remodeling inhibition and deregulation of cofilin are conserved for several Nef variants with weak PAK2 association. (A) Representative micrographs of Jurkat T lymphocytes (Jurkat CCR7) transfected with siRNA oligonucleotides specific for PAK2 or a nonspecific scrambled siRNA (scr.) together with the indicated expression plasmids. Cells were fixed 20 min after treatment with 200 ng/ml SDF-1α and stained for F-actin. Shown are merge pictures of the GFP and F-actin channels. Scale bar = 10 μm. (B) Western blot analysis of lysates of the cells used in panel A. MLC, myosin light chain as loading control. (C) Frequency of the cells shown in panel A that display membrane ruffling in response to treatment with SDF-1α. Depicted are mean values from three independent experiments ± SD, with at least 100 cells analyzed per condition. (D) Representative micrographs of Jurkat T lymphocytes (Jurkat CCR7) transfected with siRNA oligonucleotides specific for PAK2 or a nonspecific scrambled siRNA (scr.) together with the indicated expression plasmids. Cells were plated onto cover glasses, fixed, and stained for p-cofilin. Scale bar = 10 μm. p-cofilin and GFP panels show identical fields of view, and the arrows point at transfected cells. (E) Frequency of the cells shown in panel D with high p-cofilin levels. Depicted are mean values from three independent experiments ± SD, with at least 100 cells analyzed per transfection; cells were scored as containing high p-cofilin levels when they were visibly brighter than untransfected neighboring cells.

Similar articles

Cited by

References

    1. Agopian, K., B. L. Wei, J. V. Garcia, and D. Gabuzda. 2006. A hydrophobic binding surface on the human immunodeficiency virus type 1 Nef core is critical for association with p21-activated kinase 2. J. Virol. 80:3050-3061. - PMC - PubMed
    1. Arora, V. K., R. P. Molina, J. L. Foster, J. L. Blakemore, J. Chernoff, B. L. Fredericksen, and J. V. Garcia. 2000. Lentivirus Nef specifically activates Pak2. J. Virol. 74:11081-11087. - PMC - PubMed
    1. Bamburg, J. R., and B. W. Bernstein. 2008. ADF/cofilin. Curr. Biol. 18:R273-R275. - PubMed
    1. Bokoch, G. M. 2003. Biology of the p21-activated kinases. Annu. Rev. Biochem. 72:743-781. - PubMed
    1. Brown, A., X. Wang, E. Sawai, and C. Cheng-Mayer. 1999. Activation of the PAK-related kinase by human immunodeficiency virus type 1 Nef in primary human peripheral blood lymphocytes and macrophages leads to phosphorylation of a PIX-p95 complex. J. Virol. 73:9899-9907. - PMC - PubMed

Publication types

MeSH terms

Substances