

Thinking about walking: effects of conscious correction versus distraction on locomotor adaptation
- PMID: 20147417
- PMCID: PMC2853281
- DOI: 10.1152/jn.00832.2009
Thinking about walking: effects of conscious correction versus distraction on locomotor adaptation
Abstract
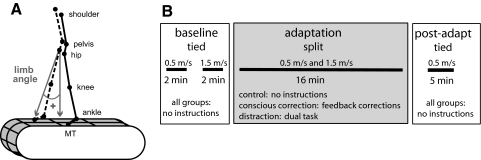
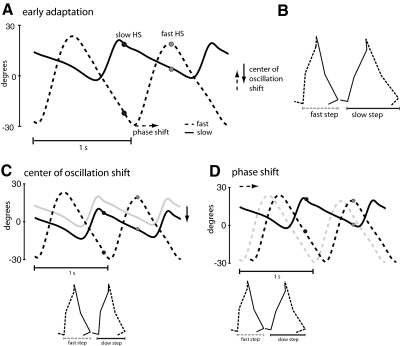
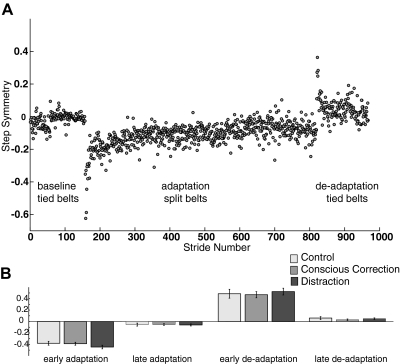
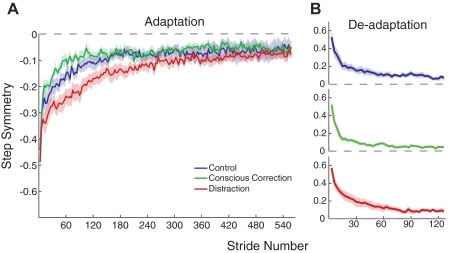
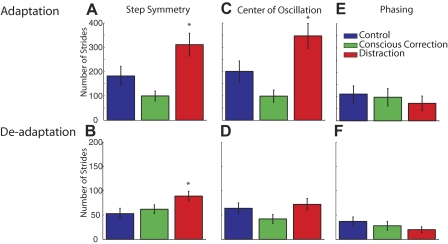
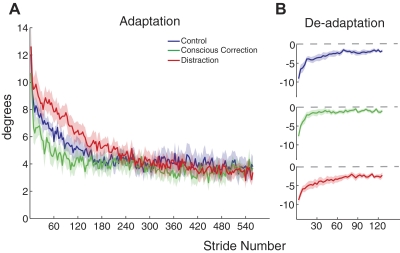
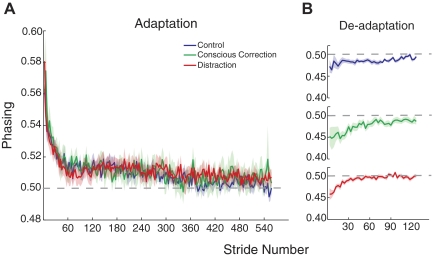
Control of the human walking pattern normally requires little thought, with conscious control used only in the face of a challenging environment or a perturbation. We have previously shown that people can adapt spatial and temporal aspects of walking to a sustained perturbation generated by a split-belt treadmill. Here we tested whether conscious correction of walking, versus distraction from it, modifies adaptation. Conscious correction of stepping may expedite the adaptive process and help to form a new walking pattern. However, because walking is normally an automatic process, it is possible that conscious effort could interfere with adaptation, whereas distraction might improve it by removing competing voluntary control. Three groups of subjects were studied: a control group was given no specific instructions, a conscious correction group was instructed how to step and given intermittent visual feedback of stepping during adaptation, and a distraction group performed a dual-task during adaptation. After adaptation, retention of aftereffects was assessed in all groups during normal treadmill walking without conscious effort, feedback, or distraction. We found that conscious correction speeds adaptation, whereas distraction slows it. Subjects trained with distraction retained aftereffects longest, suggesting that the training used during adaptation predicts the time course of deadaptation. An unexpected finding was that these manipulations affected the adaptation rate of spatial but not temporal elements of walking. Thus conscious processes can preferentially access the spatial walking pattern. It may be that spatial and temporal controls of locomotion are accessible through distinct neural circuits, with the former being most sensitive to conscious effort or distraction.
Figures
Similar articles
-
Locomotor adaptation.Prog Brain Res. 2011;191:65-74. doi: 10.1016/B978-0-444-53752-2.00013-8. Prog Brain Res. 2011. PMID: 21741544 Free PMC article. Review.
-
Altering attention to split-belt walking increases the generalization of motor memories across walking contexts.J Neurophysiol. 2020 May 1;123(5):1838-1848. doi: 10.1152/jn.00509.2019. Epub 2020 Apr 1. J Neurophysiol. 2020. PMID: 32233897 Free PMC article.
-
Concurrent locomotor adaptation and retention to visual and split-belt perturbations.PLoS One. 2022 Dec 30;17(12):e0279585. doi: 10.1371/journal.pone.0279585. eCollection 2022. PLoS One. 2022. PMID: 36584009 Free PMC article.
-
Optic flow improves adaptability of spatiotemporal characteristics during split-belt locomotor adaptation with tactile stimulation.Exp Brain Res. 2016 Feb;234(2):511-22. doi: 10.1007/s00221-015-4484-5. Epub 2015 Nov 2. Exp Brain Res. 2016. PMID: 26525712 Free PMC article.
-
Neural Control of Human Locomotor Adaptation: Lessons about Changes with Aging.Neuroscientist. 2022 Oct;28(5):469-484. doi: 10.1177/10738584211013723. Epub 2021 May 20. Neuroscientist. 2022. PMID: 34014124 Review.
Cited by
-
Stimulating the cerebellum affects visuomotor adaptation but not intermanual transfer of learning.Cerebellum. 2013 Dec;12(6):781-93. doi: 10.1007/s12311-013-0486-7. Cerebellum. 2013. PMID: 23625383 Free PMC article.
-
Split-belt walking: adaptation differences between young and older adults.J Neurophysiol. 2012 Aug;108(4):1149-57. doi: 10.1152/jn.00018.2012. Epub 2012 May 23. J Neurophysiol. 2012. PMID: 22623488 Free PMC article.
-
Seeing the Errors You Feel Enhances Locomotor Performance but Not Learning.Curr Biol. 2016 Oct 24;26(20):2707-2716. doi: 10.1016/j.cub.2016.08.012. Epub 2016 Sep 22. Curr Biol. 2016. PMID: 27666970 Free PMC article.
-
Distinct motor strategies underlying split-belt adaptation in human walking and running.PLoS One. 2015 Mar 16;10(3):e0121951. doi: 10.1371/journal.pone.0121951. eCollection 2015. PLoS One. 2015. PMID: 25775426 Free PMC article.
-
Learning to be economical: the energy cost of walking tracks motor adaptation.J Physiol. 2013 Feb 15;591(4):1081-95. doi: 10.1113/jphysiol.2012.245506. Epub 2012 Dec 17. J Physiol. 2013. PMID: 23247109 Free PMC article.
References
-
- Arshavsky YI, Gelfand IM, Orlovsky GN, Pavlova GA. Messages conveyed by descending tracts during scratching in the cat. I. Activity of vestibulospinal neurons. Brain Res 159: 99–110, 1978a - PubMed
-
- Arshavsky YI, Gelfand IM, Orlovsky GN, Pavlova GA. Messages conveyed by spinocerebellar pathways during scratching in the cat. I. Activity of neurons of the lateral reticular nucleus. Brain Res 151: 479–491, 1978b - PubMed
-
- Arshavsky YI, Gelfand IM, Orlovsky GN, Pavlova GA. Messages conveyed by spinocerebellar pathways during scratching in the cat. II. Activity of neurons of the ventral spinocerebellar tract. Brain Res 151: 493–506, 1978c - PubMed
Publication types
MeSH terms
Grants and funding
LinkOut - more resources
Full Text Sources