. 2010 Apr;103(4):1809-22.
doi: 10.1152/jn.00281.2009. Epub 2010 Feb 10.

Neural coding of periodicity in marmoset auditory cortex

Affiliations

Neural coding of periodicity in marmoset auditory cortex

Daniel Bendor et al. J Neurophysiol. 2010 Apr.

Abstract

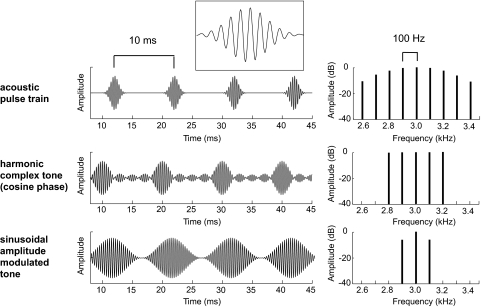
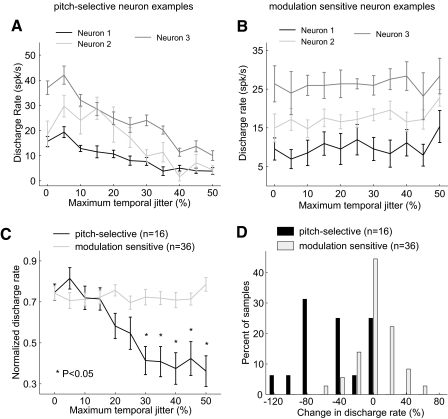
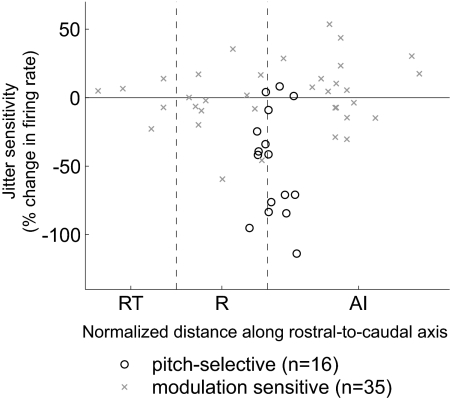
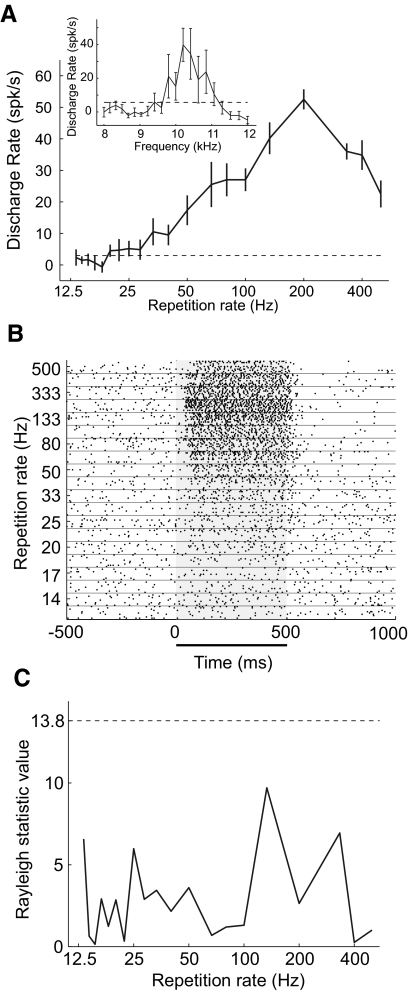
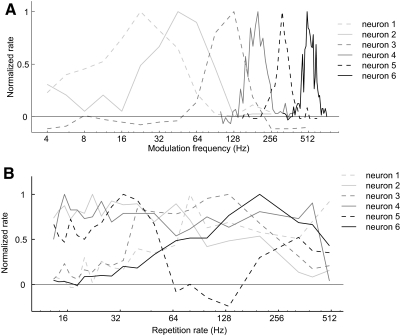
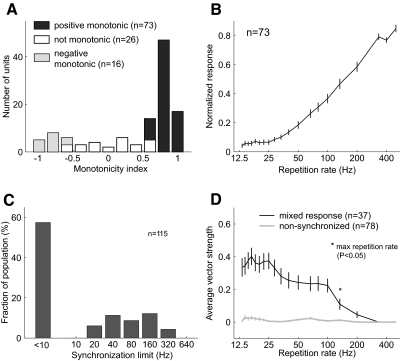
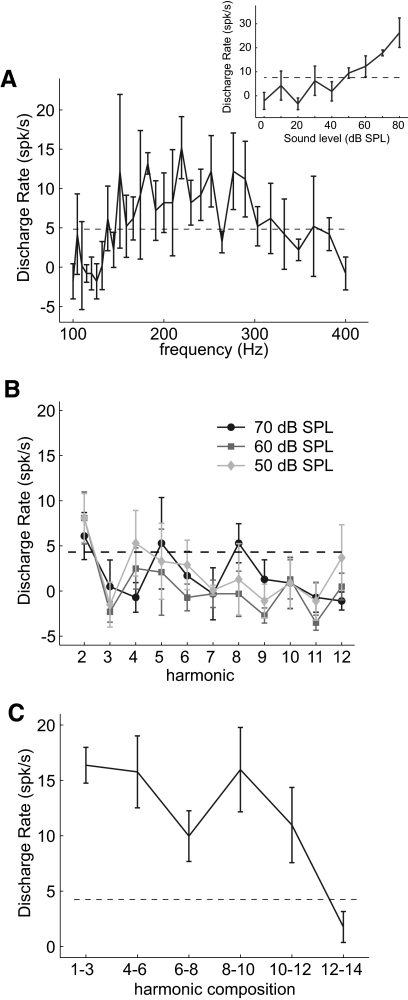
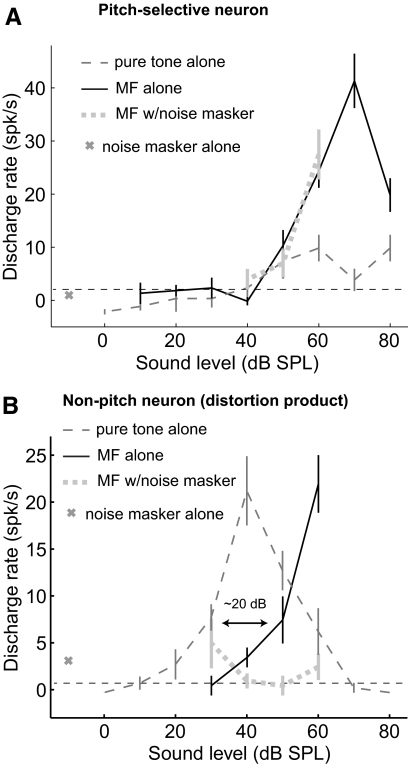
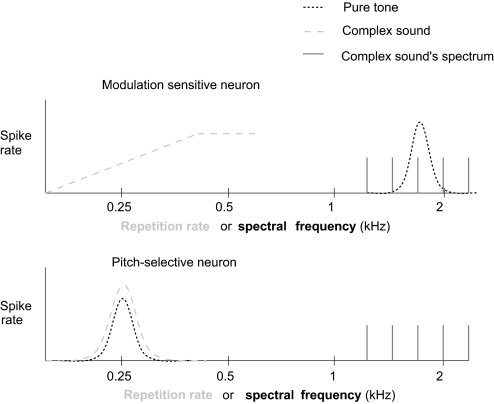
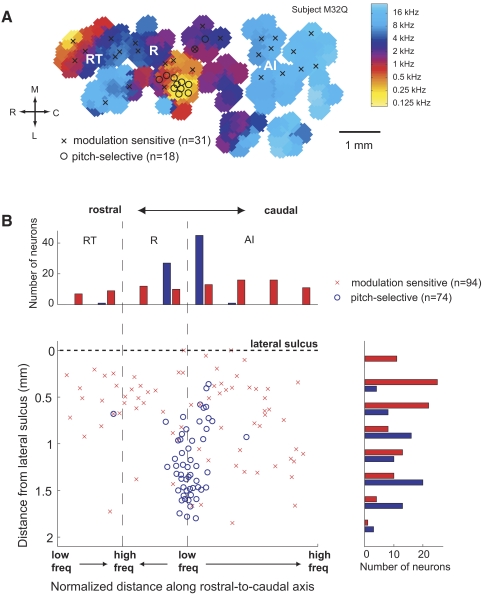
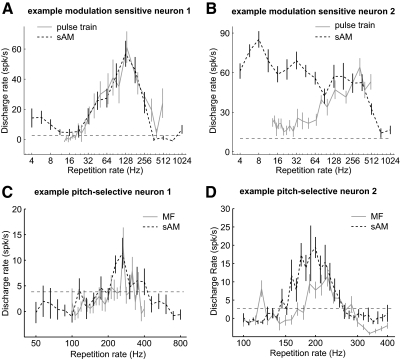
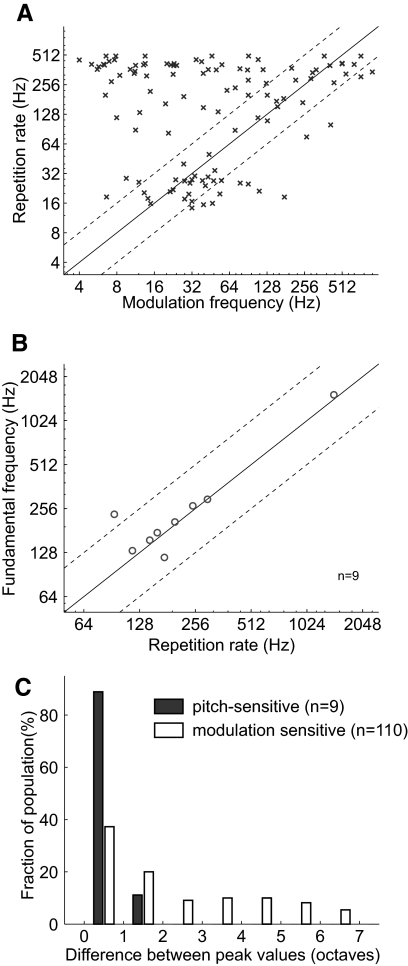
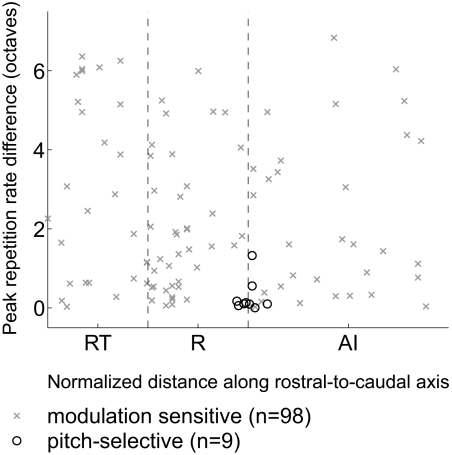
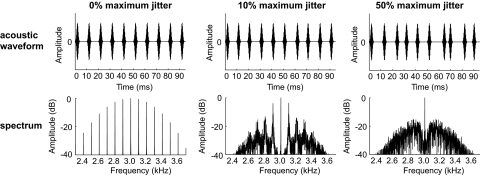
Pitch, our perception of how high or low a sound is on a musical scale, crucially depends on a sound's periodicity. If an acoustic signal is temporally jittered so that it becomes aperiodic, the pitch will no longer be perceivable even though other acoustical features that normally covary with pitch are unchanged. Previous electrophysiological studies investigating pitch have typically used only periodic acoustic stimuli, and as such these studies cannot distinguish between a neural representation of pitch and an acoustical feature that only correlates with pitch. In this report, we examine in the auditory cortex of awake marmoset monkeys (Callithrix jacchus) the neural coding of a periodicity's repetition rate, an acoustic feature that covaries with pitch. We first examine if individual neurons show similar repetition rate tuning for different periodic acoustic signals. We next measure how sensitive these neural representations are to the temporal regularity of the acoustic signal. We find that neurons throughout auditory cortex covary their firing rate with the repetition rate of an acoustic signal. However, similar repetition rate tuning across acoustic stimuli and sensitivity to temporal regularity were generally only observed in a small group of neurons found near the anterolateral border of primary auditory cortex, the location of a previously identified putative pitch processing center. These results suggest that although the encoding of repetition rate is a general component of auditory cortical processing, the neural correlate of periodicity is confined to a special class of pitch-selective neurons within the putative pitch processing center of auditory cortex.


Figures

Fig. 1.
Fig. 1.
Acoustic stimulus. Acoustic waveform (left) and spectrum (right) of a Gaussian narrowband acoustic pulse train (top), a missing fundamental harmonic complex tone (middle), and a sinusoidally amplitude modulated (sAM) tone (bottom). The acoustic pulse train has a 3 kHz carrier, 100 Hz repetition rate, and σ = 0.89. Inset: an enlarged view of a single Gaussian pulse. The missing fundamental harmonic complex tone is composed of harmonics 28–32 and has a 100 Hz fundamental frequency (repetition rate). The sAM tone has a modulation frequency of 100 Hz and a 3 kHz carrier.
Fig. 14.
Fig. 14.
Comparison of sensitivity to temporal irregularity between pitch-selective and modulation sensitive neurons. A: individual examples of regular and irregular pulse train responses in pitch-selective neurons. Neuron 1 (unit M32Q-101.1, rectangular clicks), neuron 2 (unit M41O-276.1, acoustic pulse train with tone carrier), neuron 3 (unit M36N-523.1, acoustic pulse train with noise carrier). B: individual examples of regular and irregular pulse train responses in modulation sensitive neurons: neuron 1 (unit M2P-357.2, field RT), neuron 2 (unit M32Q-117.1, field R), neuron 3 (unit M36N-418.1, field AI). C: normalized tuning in pitch-selective and modulation sensitive neurons to acoustic pulse trains varying in temporal irregularity. For pitch-selective neurons, normalized responses for all jitter values significantly different from regular click trains (P < 0.05 Bonferonni corrected, Wilcoxon rank sum test) are indicated (*). Normalized responses of modulation sensitive neurons to irregular acoustic pulse trains were not significantly different from regular acoustic pulse trains. D: a comparison between pitch-selective and modulation sensitive neurons in their interpolated percent change in discharge rate between a regular and irregular (50% jitter) acoustic pulse train. The 2 distributions are significantly different (P < 3.6× 10⁻⁵, Wilcoxon rank sum test).
Fig. 15.
Fig. 15.
Topographic distribution of temporal regularity sensitivity. Temporal regularity sensitivity (from Fig. 14D) of modulation sensitive and pitch-selective neurons plotted according to their position along the rostro-caudal axis of auditory cortex (in normalized coordinates). The dashed vertical lines indicate the boundaries between AI/R and R/RT.
Fig. 2.
Fig. 2.
Response from an individual modulation sensitive neuron. A: discharge rate of a neuron [unit M2P-921.1, primary auditory cortex/rostral field (AI/R) border] to acoustic pulse trains (σ = 0.89). Inset: the response of the neuron to pure tones varying in frequency. Error bars indicate the SE. B: raster plot of the neuron shown in A responding to acoustic pulse trains at different repetition rates (13–500 Hz). The horizontal line underneath the raster plot indicates the time period that the acoustic stimulus was played. C: Rayleigh statistic for neuronal response shown in A. None of these responses reached the criteria for statistical significance (13.8, P < 0.001) which is indicated on the plot with a dashed horizontal line.
Fig. 3.
Fig. 3.
Modulation frequency and repetition rate tuning in modulation sensitive neurons. A: modulation frequency tuning to sAM tones for 6 neurons in auditory cortex: neuron 1 (unit M41O-242.1), neuron 2 (unit M2P-109.1), neuron 3 (unit M32Q-348.1), neuron 4 (unit M41O-248.2), neuron 5 (unit M41O-241.1), neuron 6 (unit M2P-56.1). Neuron 3 was recorded in field AI. The remaining neurons were recorded from field R. B: repetition rate tuning to acoustic pulse trains for 6 neurons in auditory cortex: neuron 1 (unit M2P-799.1, field AI), neuron 2 (unit-M32Q-79.1, field R), neuron 3 (unit M2P-30.1, field AI), neuron 4 (unit M2P-843.1, field AI), neuron 5 (unit M2P-411.1, field R), neuron 6 (unit M2P-921.1, AI/R border). All neurons have significant discharge rates over a subset of repetition rates in the range of pitch perception (>30 Hz). (Note that these neurons are not the same neurons shown in Fig. 3A).
Fig. 4.
Fig. 4.
Rate coding and synchronization ability of modulation sensitive neurons. A: distribution of monotonicity tuning in modulation sensitive neurons. The monotonicity index is the Spearman correlation coefficient for firing rates between 30 and 500 Hz. Statistically significant Spearman correlation coefficients (P < 0.05) are indicated. B: normalized discharge rate of modulation sensitive neurons with positive monotonic responses. Neurons monotonically increased their discharge rate with increasing repetition rate over the range 25–333 Hz. Population responses at repetition rates between 40 and 200 Hz and at 400 Hz were significantly different (Wilcoxon rank sum, P < 0.05 Bonferonni corrected) from the population discharge rates at both 500 and 13 Hz. C: distribution of the synchronization limit in modulation sensitive neurons. D: mean vector strength of modulation sensitive neurons with nonsynchronized and mixed responses. Only the mixed response population had an average vector strength significantly different from zero, and only for repetition rates equal to and <133 Hz (Wilcoxon rank sum test, P < 0.05 Bonferonni corrected).
Fig. 5.
Fig. 5.
Pitch-selectivity criteria in an example pitch-selective neuron. All data are shown is from unit M2P-157.1. Error bars in A–C indicate the SE. A: frequency tuning curve for tones played at 50 dB SPL. Inset: a rate-level response at best frequency. B: response to harmonics of the best fundamental frequency (182 Hz) played individually at 0, +10, and +20 dB above the sound level threshold at the best frequency. C: response to harmonic complex tones (each harmonic is played at 50 dB SPL). All acoustic stimuli are missing the fundamental frequency except for the acoustic stimulus composed of harmonics 1–3.
Fig. 6.
Fig. 6.
Example of a pitch-selective neuron's response and a distortion product response in a nonpitch neuron. Error bars indicate the SE. A: a pitch-selective neuron's rate-level response (unit M41O-294.1) to pure tones and missing fundamental sounds (with and without a noise masker). The neuron has a similar threshold for both pure tones and missing fundamental sounds. At higher sound levels, the response to the missing fundamental is greater than the pure tone response. With the addition of the noise masker, the missing fundamental response does not change. The noise masker itself did not evoke a significant response in the neuron. B: a nonpitch neuron's rate-level response (unit M41O-251.2) to pure tones and missing fundamental sounds (with and without a noise masker). The response to missing fundamental sounds had a 20 dB higher sound level threshold. On the addition of the noise masker, the neuron no longer responded to the missing fundamental sound. This neuron was recorded from within the pitch center.
Fig. 7.
Fig. 7.
Comparison of modulation sensitive and pitch-selective neurons. Modulation sensitive neurons have different best frequencies (pure tone tuning) and best repetition rates (complex tone tuning) and respond to complex sounds with spectra overlapping their best frequency. Pitch-selective neurons have similar pure tone and complex tone tuning and respond to complex sounds with spectra that do not overlap with their best frequency.
Fig. 8.
Fig. 8.
Best frequency (BF) distribution of pitch-selective and modulation sensitive neurons. Distribution of the BF of pitch-selective and modulation sensitive neurons across 4 subjects (5 hemispheres). Pitch-selective neurons had a significantly lower BF (Wilcoxon rank sum test, P < 7.4 × 10⁻²⁹).
Fig. 9.
Fig. 9.
Spatial distribution of pitch-selective and modulation sensitive neurons. A: frequency map from 1 subject (M32Q-left hemisphere) with the location of pitch-selective neurons and modulation sensitive neurons indicated. B: normalized cortical map of locations of pitch-selective and modulation sensitive neurons across four subjects (4 hemispheres).
Fig. 10.
Fig. 10.
Repetition rate tuning of modulation sensitive and pitch-selective neurons to 2 different acoustic stimuli. Error bars in A–D indicate the SE. A: similar repetition rate tuning for acoustic pulse trains and sAM tones for a neuron in auditory cortex (unit M2P-901.2, AI/R border). B: dissimilar repetition rate tuning for acoustic pulse trains and sAM tones for a neuron in auditory cortex [unit M2P-311.2, field rostrotemporal (RT)]. C. similar repetition rate tuning for a missing fundamental complex tone and an sAM tone for a pitch-selective neuron (unit M2P-233.1). D: similar repetition rate tuning for a missing fundamental complex tone and an sAM tone for a pitch-selective neuron (unit M41O-248.2).
Fig. 11.
Fig. 11.
Similarity in repetition rate tuning for 2 acoustic signals. A: comparison of the weighted best modulation frequency (sAM tones) and weighted best repetition rate (acoustic pulse trains) for individual neurons within auditory cortex. The correlation was not statistically significant (Spearman correlation coefficient, r = −0.0091, P = 0.9252). The solid diagonal line indicates where y = x. The dashed diagonal lines indicate the 1 octave boundaries surrounding the y = x line. B: comparison of the weighted best fundamental frequency (missing fundamental complex tones) and weighted best repetition rate (sAM tone or acoustic pulse trains) for individual pitch-selective neurons. The correlation did reach statistical significance (Spearman correlation coefficient, r = 0.65, P = 0.067). C: a histogram of the absolute difference in peak values for repetition rate tuning in the 2 acoustic stimuli used in A and B. Pitch-selective neurons have a more similar best repetition rate for 2 spectrally different acoustic stimuli (Wilcoxon rank sum test, P < 2.0 × 10⁻⁴).
Fig. 12.
Fig. 12.
Topographic distribution of repetition rate tuning similarity. Peak repetition rate difference (from Fig. 11) of modulation sensitive and pitch-selective neurons plotted according to their position along the rostrocaudal axis of auditory cortex (in normalized coordinates). The dashed vertical lines indicate the boundaries between AI/R and R/RT.
Fig. 13.
Fig. 13.
Acoustic stimuli used to test temporal regularity sensitivity. Acoustic waveform (top) and spectrum (bottom) of a Gaussian narrowband acoustic pulse train with a 3 kHz carrier, 100 Hz average repetition rate, and σ = 0.89 with 0% (left), 10% (middle), or 50% (right) temporal jitter.

Comment in

References

    1. Anderson SE, Kilgard MP, Sloan AM, Rennaker RL. Response to broadband repetitive stimuli in auditory cortex of the unanesthetized rat. Hear Res 213: 107–117, 2006 - PubMed
    1. Bartlett EL, Wang X. Neural representations of temporally modulated signals in the auditory thalamus of awake primates. J Neurophysiol 97: 1005–1017, 2007 - PubMed
    1. Baumann U, Nobbe A. Pulse rate discrimination with deeply inserted electrode arrays. Hear Res 196: 49–57, 2004 - PubMed
    1. Bendor D, Wang X. The neuronal representation of pitch in primate auditory cortex. Nature 436: 1161–1165, 2005 - PMC - PubMed
    1. Bendor D, Wang X. Cortical representations of pitch in monkeys and humans. Curr Opin Neurobiol 16: 391–399, 2006 - PMC - PubMed

Publication types

LinkOut - more resources