

Growth factor erv1-like modulates Drp1 to preserve mitochondrial dynamics and function in mouse embryonic stem cells
- PMID: 20147447
- PMCID: PMC2847526
- DOI: 10.1091/mbc.e09-11-0937
Growth factor erv1-like modulates Drp1 to preserve mitochondrial dynamics and function in mouse embryonic stem cells
Abstract
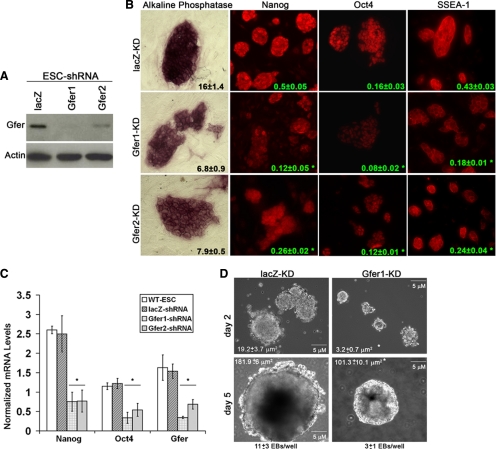
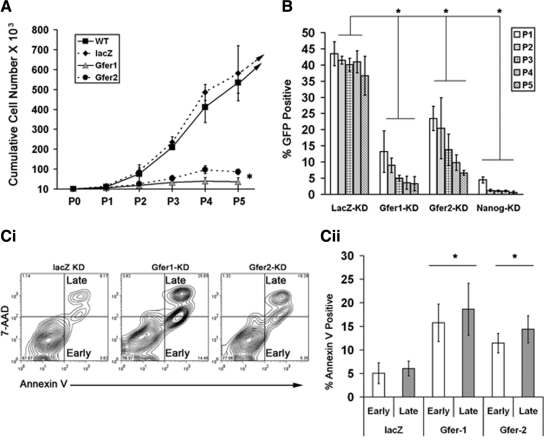
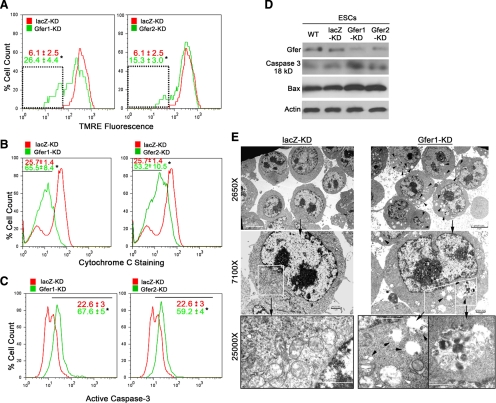
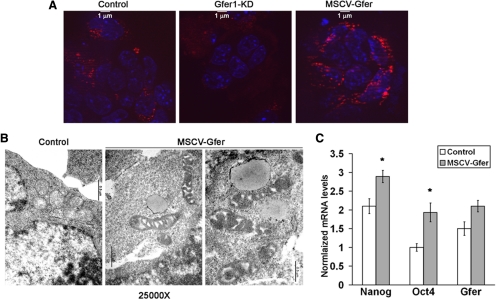
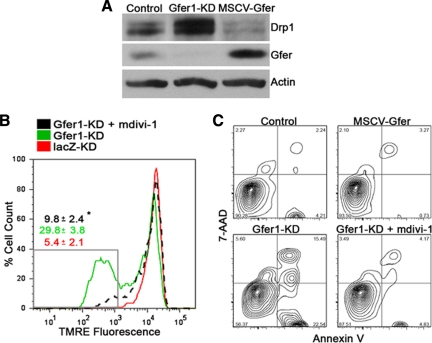
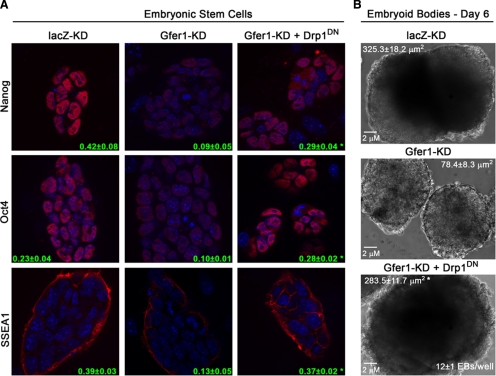
The relationship of mitochondrial dynamics and function to pluripotency are rather poorly understood aspects of stem cell biology. Here we show that growth factor erv1-like (Gfer) is involved in preserving mouse embryonic stem cell (ESC) mitochondrial morphology and function. Knockdown (KD) of Gfer in ESCs leads to decreased pluripotency marker expression, embryoid body (EB) formation, cell survival, and loss of mitochondrial function. Mitochondria in Gfer-KD ESCs undergo excessive fragmentation and mitophagy, whereas those in ESCs overexpressing Gfer appear elongated. Levels of the mitochondrial fission GTPase dynamin-related protein 1 (Drp1) are highly elevated in Gfer-KD ESCs and decreased in Gfer-overexpressing cells. Treatment with a specific inhibitor of Drp1 rescues mitochondrial function and apoptosis, whereas expression of Drp1-dominant negative resulted in the restoration of pluripotency marker expression in Gfer-KD ESCs. Altogether, our data reveal a novel prosurvival role for Gfer in maintaining mitochondrial fission-fusion dynamics in pluripotent ESCs.
Figures
Similar articles
-
A novel Gfer-Drp1 link in preserving mitochondrial dynamics and function in pluripotent stem cells.Autophagy. 2010 Aug;6(6):821-2. doi: 10.1091/mbc.E09-11-0937. Epub 2010 Aug 9. Autophagy. 2010. PMID: 20581476
-
Gfer inhibits Jab1-mediated degradation of p27kip1 to restrict proliferation of hematopoietic stem cells.Mol Biol Cell. 2011 Apr 15;22(8):1312-20. doi: 10.1091/mbc.E10-08-0723. Epub 2011 Feb 23. Mol Biol Cell. 2011. PMID: 21346186 Free PMC article.
-
Drp1 is dispensable for mitochondria biogenesis in induction to pluripotency but required for differentiation of embryonic stem cells.Stem Cells Dev. 2014 Oct 15;23(20):2422-34. doi: 10.1089/scd.2014.0059. Epub 2014 Aug 4. Stem Cells Dev. 2014. PMID: 24937776
-
[Mechanism of mitochondrial fission - structure and function of Drp1 protein].Postepy Biochem. 2016;62(2):127-137. Postepy Biochem. 2016. PMID: 28132464 Review. Polish.
-
A mitochondrial delicacy: dynamin-related protein 1 and mitochondrial dynamics.Am J Physiol Cell Physiol. 2018 Jul 1;315(1):C80-C90. doi: 10.1152/ajpcell.00042.2018. Epub 2018 Apr 18. Am J Physiol Cell Physiol. 2018. PMID: 29669222 Free PMC article. Review.
Cited by
-
Crosstalk between the mitochondrial fission protein, Drp1, and the cell cycle is identified across various cancer types and can impact survival of epithelial ovarian cancer patients.Oncotarget. 2016 Sep 13;7(37):60021-60037. doi: 10.18632/oncotarget.11047. Oncotarget. 2016. PMID: 27509055 Free PMC article.
-
Mitochondrial Fusion by M1 Promotes Embryoid Body Cardiac Differentiation of Human Pluripotent Stem Cells.Stem Cells Int. 2019 Sep 19;2019:6380135. doi: 10.1155/2019/6380135. eCollection 2019. Stem Cells Int. 2019. PMID: 31641358 Free PMC article.
-
Autophagy and pluripotency: self-eating your way to eternal youth.Trends Cell Biol. 2022 Oct;32(10):868-882. doi: 10.1016/j.tcb.2022.04.001. Epub 2022 Apr 28. Trends Cell Biol. 2022. PMID: 35490141 Free PMC article. Review.
-
Involvement of hepatic stimulator substance in the regulation of hepatoblast maturation into hepatocytes in vitro.Stem Cells Dev. 2014 Jul 15;23(14):1675-87. doi: 10.1089/scd.2013.0468. Epub 2014 May 2. Stem Cells Dev. 2014. PMID: 24640968 Free PMC article.
-
Development and Functions of Mitochondria in Early Life.Newborn (Clarksville). 2022 Jan-Mar;1(1):131-141. doi: 10.5005/jp-journals-11002-0013. Newborn (Clarksville). 2022. PMID: 37206110 Free PMC article.
References
-
- Akao M., O'Rourke B., Teshima Y., Seharaseyon J., Marban E. Mechanistically distinct steps in the mitochondrial death pathway triggered by oxidative stress in cardiac myocytes. Circ. Res. 2003;92:186–194. - PubMed
-
- Baharvand H., Matthaei K. I. The ultrastructure of mouse embryonic stem cells. Reprod. Biomed. Online. 2003;7:330–335. - PubMed
-
- Becher D., Kricke J., Stein G., Lisowsky T. A mutant for the yeast scERV1 gene displays a new defect in mitochondrial morphology and distribution. Yeast. 1999;15:1171–1181. - PubMed
-
- Burdon T., Smith A., Savatier P. Signalling, cell cycle and pluripotency in embryonic stem cells. Trends Cell Biol. 2002;12:432–438. - PubMed
Publication types
MeSH terms
Substances
Grants and funding
LinkOut - more resources
Full Text Sources
Other Literature Sources
Molecular Biology Databases
Research Materials
Miscellaneous
