. 2010 Jun;38(10):3477-88.
doi: 10.1093/nar/gkq046. Epub 2010 Feb 10.

Structure of Smad1 MH1/DNA complex reveals distinctive rearrangements of BMP and TGF-beta effectors

Affiliations

Structure of Smad1 MH1/DNA complex reveals distinctive rearrangements of BMP and TGF-beta effectors

Nithya BabuRajendran et al. Nucleic Acids Res. 2010 Jun.

Abstract

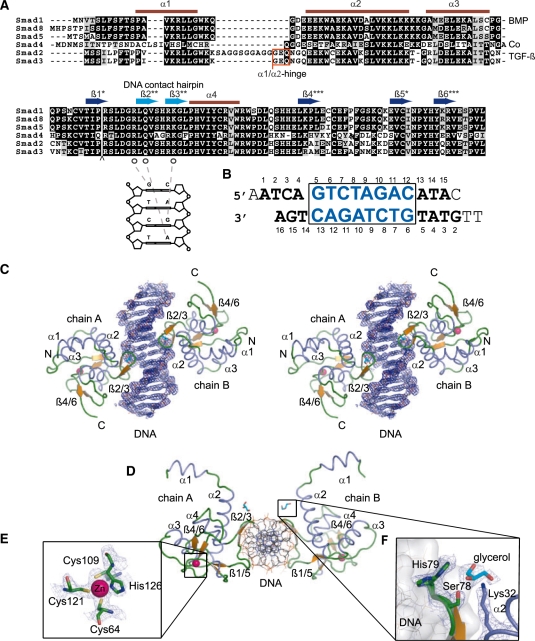
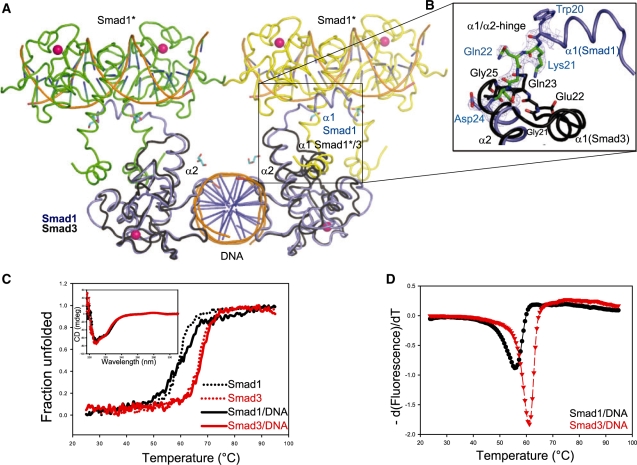
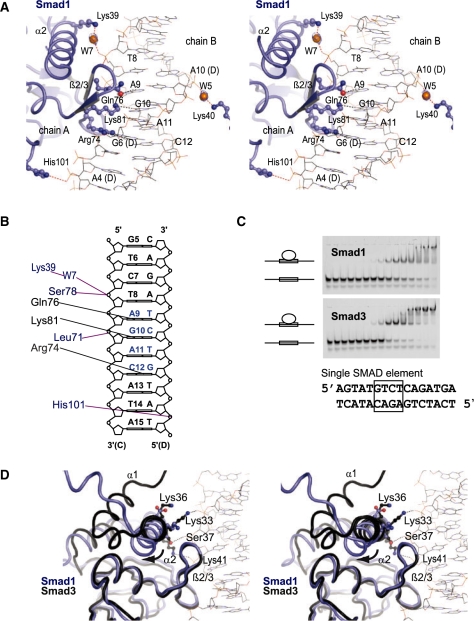
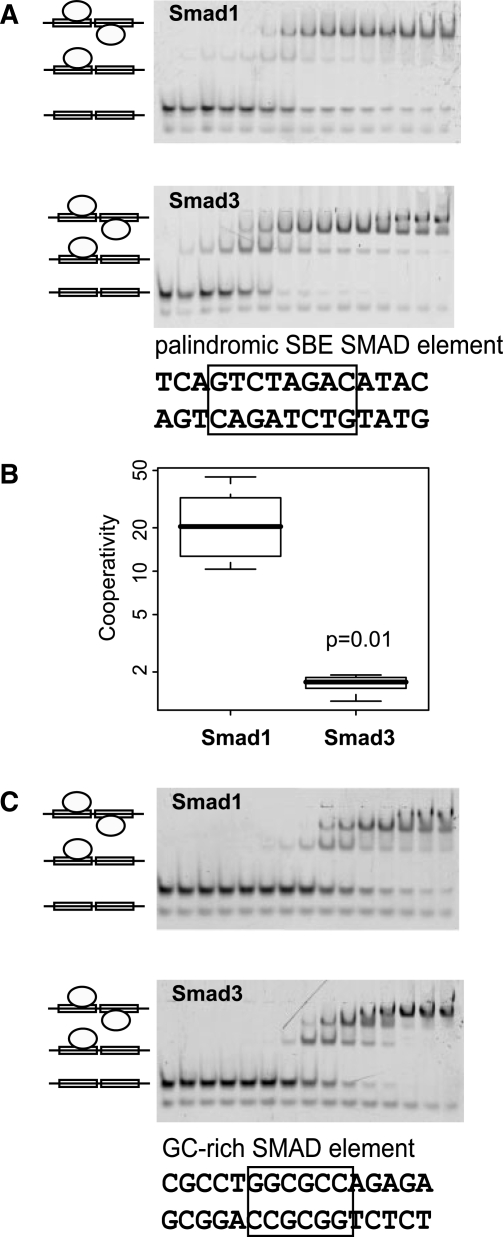
Smad1 is a downstream effector of the BMP signaling pathway that binds regulatory DNA to execute gene expression programs leading to, for example, the maintenance of pluripotency in mice. On the contrary, the TGF-beta-activated Smad3 triggers strikingly different programs such as mesodermal differentiation in early development. Because Smad1 and Smad3 contain identical amino acids at the DNA contact interface it is unclear how they elicit distinctive bioactivities. Here, we report the crystal structure of the MH1 domain of Smad1 bound to a palindromic Smad binding element. Surprisingly, the DNA contact interface of Smad1 is drastically rearranged when compared to Smad3. The N-terminal helix 1 of Smad1 is dislodged from its intramolecular binding site and adopts a domain swapped arrangement with a symmetry-related molecule. As a consequence, helix 2 kinks away from the double helix disabling several key phosphate backbone interactions. Thermal melting analysis corroborates a decompacted conformation of Smad1 and DNA binding assays indicate a lower overall affinity of Smad1 to DNA but increased cooperativity when binding to palindromic DNA motifs. These findings suggest that Smad1 and Smad3 evolved differential qualities to assemble on composite DNA elements and to engage in co-factor interactions by remodeling their N-termini.


Figures

Figure 1.
Figure 1.
(A) Multiple sequence alignment of the MH1 domains of mouse Smads prepared using t_coffee (60) and boxshade (http://www.ch.embnet.org/software/BOX_form.html). Secondary structure elements as seen in the Smad1 structure are indicated above the alignments and asterisks mark pairing β-strands. The TGF-β/Smad specific α1/α2 insertion in Smad3 and Smad2 between helix α1 and helix α2 is marked with a red box. The highly conserved amino acid residues Arg74, Gln76 and Lys81 in the β-hairpin (β2–β3) contacting specific DNA nucleotides are marked by open circles. The arrow indicates a 30 amino acid insertion of Smad2 that was omitted for clarity. (B) The sequence of the 17-mer SBE DNA with TT–AA overhangs used for crystallization. The nucleotides which were not modeled in the structure are not numbered, while the other nucleotides are numbered as deposited in the PDB. The SBE palindrome GTCTAGAC is boxed and shown in blue. (C) A stereo view of the overall structure of Smad1 MH1 with two monomers of Smad1 MH1 shown as cartoon bound to palindromic SBE DNA in stick representation. α-Helices are colored in blue, β-sheets in orange and loop regions in green. All structural figures were prepared using pymol. The composite omit map of the DNA region calculated using CNS is shown in blue contoured at the 1.0σ-level. (D) Top view of the Smad1 MH1 with SBE DNA (rotated by 90° with respect to C). (E) Details of the zinc coordination site including Cys64, Cys109, Cys121 and His126. The electron density (2FoFc) is displayed at the 2σ-level. (F) The alternate rotamers of the His79 residue showing one of the rotamers facing the glycerol and the other facing the DNA with (2FoFc) electron density contoured at 1.0σ. The electron density of glycerol molecule is contoured at 0.7σ. The other amino acids Ser78 and Lys32 stabilizing the glycerol on either side are contoured at 1.0σ.
Figure 2.
Figure 2.
(A) Domain swap between adjacent symmetry-related Smad1 MH1/SBE complexes coloured in green, yellow and blue. The Smad3 MH1/SBE complex (1OZJ) colored in black is super imposed onto the blue Smad1 MH1/SBE. The domain swap region is boxed to highlight the difference in helix α1 between Smad1 MH1 and Smad3 MH1. Symmetry-related Smad1 molecules are indicated with asterisks and colored green and yellow. (B) Magnification of the domain swapped region boxed in A displaying the Smad1 α1/α2 hinge in green with corresponding composite omit map contoured at 1.0σ and helices α1 and helix α2 in blue. The corresponding region of Smad3 is shown in black with TGF-β specific α1/α2-hinge residues Gly21, Glu22 and Gln23 (Smad3 numbering) shown as sticks. (C) Thermal unfolding profiles of Smad1 MH1/SBE in black and Smad3 MH1/SBE in red recorded by measuring the CD signal at 222 nm when heating from 25°C to 95°C indicating a lower melting point of Smad1 MH1/SBE (58°C) and as compared to Smad3 MH1/SBE (67°C). Melting curves recorded in the absence of DNA are shown as dotted lines. Circular dichroism spectra of Smad1 MH1/SBE (black) and Smad3 MH1/SBE (red) complexes are included as an inset. (D) Thermofluor-based melting profiles of Smad1 MH1 and Smad3 MH1 in the presence of SBE DNA is plotted as a function of temperature (°C) versus –d(fluorescence)/dT. Smad1 MH1/SBE (black circle) shows a lower melting point compared to the Smad3 MH1/SBE (red triangle).
Figure 3.
Figure 3.
(A) A stereo view of protein–DNA interaction of Smad1 MH1 domain highlighting nucleotide-specific interactions of Arg74, Gln76 and Lys81 with the bases A9, G10, A11 and C12 of the SBE DNA. The water molecules, W5 and W7, mediating further interactions of are also shown. (B) Schematic drawing of the SBE DNA marking amino acids engaging in specific DNA contacts (black) as well as phosphate backbone and water-mediated contacts (blue). (C) Ten percent native gel showing 1nM SB DNA element (5′AGTATGTCTCAGATGA3′) incubated with increasing concentrations of Smad1 and Smad3 MH1 proteins. Protein concentrations used were 0, 0.61, 1.22, 2.44, 4.88, 9.77, 19.53, 39.06, 78.13, 156.25, 312.5, 625, 1250, 2500 and 5000 nM (from left to right). Vectors of fractions bound and corresponding protein concentrations were fit to Equation 1 (Supplementary Figure S1) and Kd’s were found to be 111.9 ± 14.5 nM for Smad1 and 41.6 ± 3.9 nM for Smad3 (mean ± standard deviation; n = 4). (D) A stereo view of the Smad1 MH1 in blue superimposed with Smad3 MH1 in black indicating the displacement of helix α2 with respect to the DNA and the loss of phosphate contacts in Smad1.
Figure 4.
Figure 4.
(A) Cooperativity of Smad1 and Smad3 on the palindromic SBE element. Ten percent native gel showing the binding of Smad1 MH1 and Smad3 MH1 to 1 nM of SBE palindromic DNA (5′TGAGTCTAGACATAC3′). The protein concentrations used were 0, 0.61, 1.22, 2.44, 4.88, 9.77, 19.53, 39.06, 78.13, 156.25, 312.5, 625, 1250, 2500 and 5000 nM (from left to right). Experiments were performed in triplicates. (B) Box-plot representing the cooperativity factor (ω = kd1/kd2) for Smad1 and Smad3 binding to the SBE palindromic element calculated as described in the ‘Materials and Methods’ section for 5–6 independent measurements including lanes where the weakest band contributed a fraction bound of at least 10%. The P-value was derived by performing a Welch two-sample t-test using R. (C) Ten percent native gel with 1 nM GC-BRE (5′CGCCTGGCGCCAGAGA) incubated with increasing concentrations of Smad1 and Smad3 MH1 proteins. Protein concentrations used were 0, 0.61, 1.22, 2.44, 4.88, 9.77, 19.53, 39.06, 78.13, 156.25, 312.5, 625, 1250, 2500 and 5000 nM (from left to right). Experiments were performed in triplicates.

References

    1. Massagué J. TGF-beta signal transduction. Annu. Rev. Biochem. 1998;67:753–791. - PubMed
    1. Massague J, Seoane J, Wotton D. Smad transcription factors. Genes Dev. 2005;19:2783–2810. - PubMed
    1. Schmierer B, Hill CS. TGFbeta-SMAD signal transduction: molecular specificity and functional flexibility. Nat. Rev. Mol. Cell Biol. 2007;8:970–982. - PubMed
    1. Kingsley D. The TGF-beta superfamily: new members, new receptors, and new genetic tests of function in different organisms. Genes Dev. 1994;8:133–146. - PubMed
    1. Whitman M. Smads and early developmental signaling by the TGFbeta superfamily. Genes Dev. 1998;12:2445–2462. - PubMed

Publication types

Associated data