Comparative Study
. 2010 Apr;91(4):992-1001.
doi: 10.3945/ajcn.2009.27812. Epub 2010 Feb 10.

Reduced caloric intake during endotoxemia reduces arginine availability and metabolism

Affiliations
Comparative Study

Reduced caloric intake during endotoxemia reduces arginine availability and metabolism

Martijn Poeze et al. Am J Clin Nutr. 2010 Apr.

Abstract

Background: Inadequate caloric intake increases the risk of sepsis-induced complications. Metabolic changes during sepsis indicate that the availability of the amino acid l-arginine decreases. Availability of arginine may further decrease during reduced caloric intake, which thereby limits the adaptive response of arginine-nitric oxide metabolism during sepsis.

Objective: We tested the hypothesis that reduced caloric intake during endotoxemia, as an experimental model for sepsis, further reduces arginine availability.

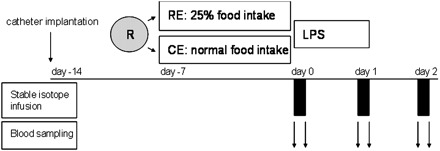
Design: In a randomized trial, a 7-d reduced caloric intake feed regimen (RE; n = 9) was compared with a normal control feed regimen (CE; n = 9), before 24 h of endotoxemia, as a model for sepsis. Whole-body arginine-nitric oxide metabolism and protein metabolism were measured by using a stable-isotope infusion of [(15)N(2)]arginine, [(13)C-(2)H(2)]citrulline, [(2)H(5)]phenylalanine, and [(2)H(2)]tyrosine. Plasma pyruvate and lactate concentrations were determined by fully automated HPLC.

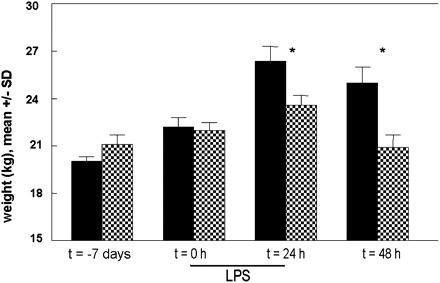
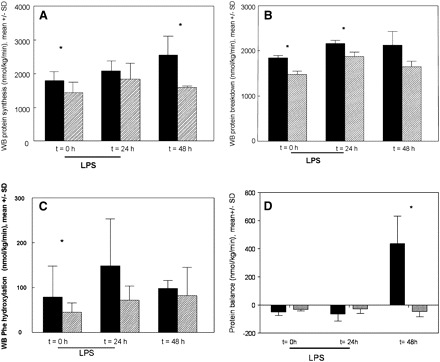
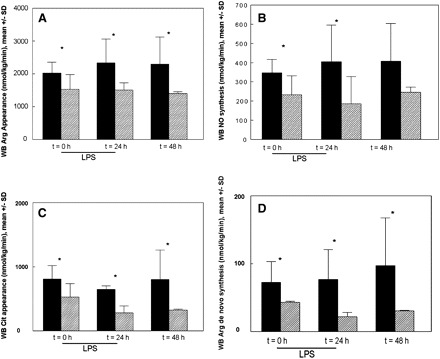
Results: Pre-endotoxin arginine appearance was significantly lower in the RE group than in the CE group (P = 0.002). During endotoxemia, arginine appearance increased in the CE animals but not in the RE animals (P = 0.04). In addition, nitric oxide production was significantly lower in the RE animals (P < 0.0001). Protein synthesis was significantly lower at the start of endotoxin infusion (P < 0.05) and remained lower during endotoxemia in the RE group than in the CE group (P < 0.001). The lactate:pyruvate ratio was not higher in the RE group than in the CE group before endotoxemia but increased significantly during endotoxemia in the RE group (P = 0.04).

Conclusion: A well-nourished condition before prolonged endotoxemia results in a better ability to adapt to endotoxin-induced metabolic deterioration of arginine-nitric oxide metabolism than does reduced caloric intake before endotoxemia.


Figures

FIGURE 1
FIGURE 1
Illustration of the experimental design. After surgical catheter implantation (day −14), animals were randomized (R) on day 7 after surgery (day −7) to a reduced caloric intake (semistarvation) and endotoxin group (RE; n = 9) or to a normal control feed endotoxin (CE; n = 9) group for 7 d. Both groups subsequently received a lipopolysaccharide (LPS) endotoxin infusion over 24 h. Stable-isotope infusion and blood sampling were performed on days 0, 1, and 2 after the start of the endotoxin infusion.
FIGURE 2
FIGURE 2
Mean (±SD) body weight during reduced caloric intake (semistarvation) and endotoxemia (RE; shaded bars) increased significantly less (P = 0.04) during the semistarvation period than during the control endotoxemia period (CE; solid bars). Both groups subsequently received a lipopolysaccharide (LPS) endotoxin infusion over 24 h. The number of animals per time group was 9 for both groups, except at 48 h in the RE group (n = 7); the last observation carried forward principle was used to replace missing data. Weight was significantly lower in the RE animals than in the CE animals 24 and 48 h after the start of the endotoxin infusion (*P < 0.05).
FIGURE 3
FIGURE 3
Mean (±SD) whole-body (WB) protein synthesis rate (A), WB protein breakdown (PB) rate (B), WB phenylalanine (Phe) hydroxylation rate (C), and WB protein balance (D) during reduced caloric intake (semistarvation) and endotoxemia (RE, shaded bars; n = 9) compared with control endotoxemia (CE, solid bars; n = 9). Both groups subsequently received a lipopolysaccharide (LPS) endotoxin infusion (3 μg · kg body weight−1 · h−1) over 24 h. The number of animals per time group was 9 for both groups, except at 48 h in the RE group (n = 7); the last observation carried forward principle was used to replace missing data. A: WB protein synthesis was significantly lower in the RE group than in the CE group. P for group effect < 0.0001, P for time effect = 0.02, P for interaction = 0.5 (repeated-measures ANOVA). *P for individual time points <0.05. B: WB PB was significantly lower in the RE group than in the CE group. P for group effect = 0.03, P for time effect = 0.1, P for interaction = 0.6 (repeated-measures ANOVA). *P for individual time points <0.05. C: WB Phe hydroxylation was significantly lower in the RE group than in the CE group. P for group effect = 0.04, P for time effect = 0.02, P for interaction = 0.3 (repeated-measures ANOVA). *P for individual time points <0.05. D: WB protein balance was not significantly different between the RE group and the CE group. P for group effect = 0.7, P for time effect = 0.5, P for interaction = 0.1 (repeated-measures ANOVA). *P for individual time points <0.05.
FIGURE 4
FIGURE 4
Mean (±SD) whole-body (WB) arginine (Arg) appearance rate (A), nitric oxide (NO) synthesis rate (B), WB citrulline (Cit) appearance rate (C), and WB arginine de novo synthesis rate (D) during reduced caloric intake (semistarvation) and endotoxemia (RE, shaded bars; n = 9) compared with control endotoxemia (CE, solid bars; n = 9). Both groups subsequently received a lipopolysaccharide (LPS) endotoxin infusion (3 μg · kg body weight−1 · h−1) over 24 h. The number of animals per time group was 9 for both groups, except at 48 h in the RE group (n = 7); the last observation carried forward principle was used to replace missing data. A: WB arginine appearance was significantly lower in the RE group than in the CE group. P for group effect = 0.002, P for time effect = 0.06, P for interaction = 0.04 (repeated-measures ANOVA). *P for individual time points <0.05. B: WB NO synthesis was significantly lower in the RE group than in the CE group. P for group effect = 0.02, P for time effect = 0.6, P for interaction = 0.6 (repeated-measures ANOVA). *P for individual time points <0.05. C: WB citrulline appearance was significantly lower in the RE group than in the CE group. P for group effect < 0.0001, P for time effect = 0.05, P for interaction = 0.5 (repeated-measures ANOVA). *P for individual time points <0.05. D: WB arginine de novo synthesis was significantly lower in the RE group than in the CE group. P for group effect < 0.0001, P for time effect = 0.5, P for interaction = 0.3 (repeated-measures ANOVA). *P for individual time points <0.05.

Similar articles

Cited by

References

    1. Barr J, Hecht M, Flavin KE, Khorana A, Gould MK.. Outcomes in critically ill patients before and after the implementation of an evidence-based nutritional management protocol. Chest 2004;125:1446–57. - PubMed
    1. Ing AF, Meakins JL, McLean AP, Christou NV.. Determinants of susceptibility to sepsis and mortality: malnutrition vs anergy. J Surg Res 1982;323:249–55. - PubMed
    1. Milewski PJ, Threlfall CJ, Heath DF, Holbrook IB, Wilford K, Irving MH.. Intracellular free amino acids in undernourished patients with or without sepsis. Clin Sci (Lond) 1982;621:83–91. - PubMed
    1. McClave SA, Mitoraj TE, Thielmeier KA, Greenburg RA.. Differentiating subtypes (hypoalbuminemic vs marasmic) of protein-calorie malnutrition: incidence and clinical significance in a university hospital setting. JPEN J Parenter Enteral Nutr 1992;16:337–42. - PubMed
    1. Beisel WR.. Metabolic response to infection. Annu Rev Med 1975;26:9–20. - PubMed

Publication types

LinkOut - more resources