. 2010 Apr;152(4):1807-16.
doi: 10.1104/pp.109.151027. Epub 2010 Feb 10.

PlantMetabolomics.org: a web portal for plant metabolomics experiments

Affiliations

PlantMetabolomics.org: a web portal for plant metabolomics experiments

Preeti Bais et al. Plant Physiol. 2010 Apr.

Abstract

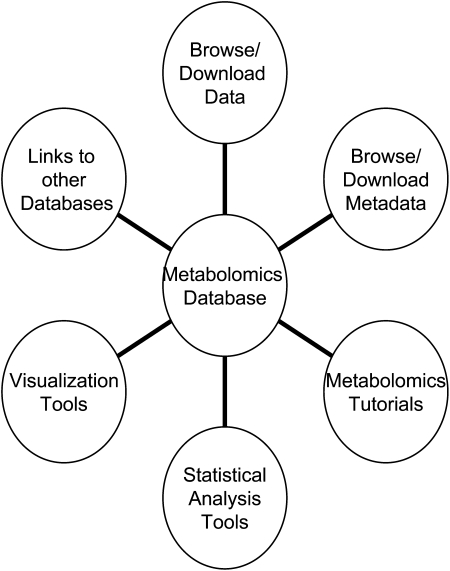
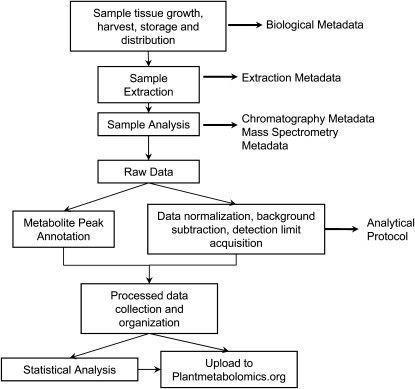
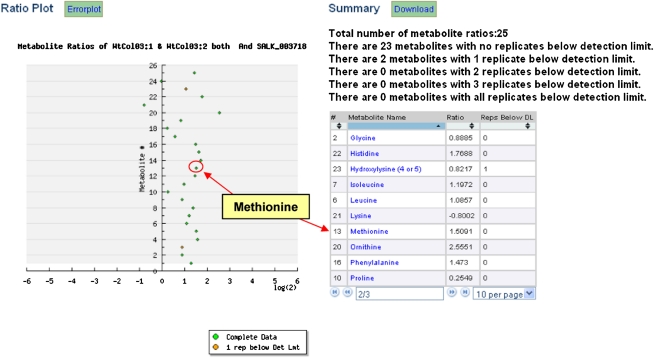
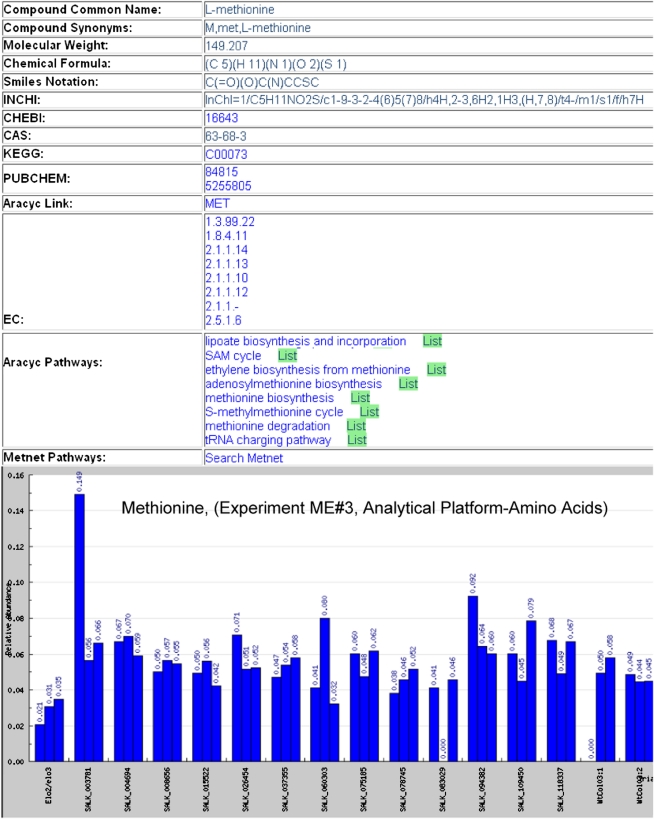
PlantMetabolomics.org (PM) is a web portal and database for exploring, visualizing, and downloading plant metabolomics data. Widespread public access to well-annotated metabolomics datasets is essential for establishing metabolomics as a functional genomics tool. PM integrates metabolomics data generated from different analytical platforms from multiple laboratories along with the key visualization tools such as ratio and error plots. Visualization tools can quickly show how one condition compares to another and which analytical platforms show the largest changes. The database tries to capture a complete annotation of the experiment metadata along with the metabolite abundance databased on the evolving Metabolomics Standards Initiative. PM can be used as a platform for deriving hypotheses by enabling metabolomic comparisons between genetically unique Arabidopsis (Arabidopsis thaliana) populations subjected to different environmental conditions. Each metabolite is linked to relevant experimental data and information from various annotation databases. The portal also provides detailed protocols and tutorials on conducting plant metabolomics experiments to promote metabolomics in the community. PM currently houses Arabidopsis metabolomics data generated by a consortium of laboratories utilizing metabolomics to help elucidate the functions of uncharacterized genes. PM is publicly available at http://www.plantmetabolomics.org.


Figures

Figure 1.
Figure 1.
Diagram of the main components of the PM portal.
Figure 2.
Figure 2.
Schematic representation of the process used in generation of metabolite data including the steps used to generate tissue, process the samples, and collect the data. At each step metadata is collected and recorded and provided in PM portal.
Figure 3.
Figure 3.
Ratio plot generated by taking the ratio of the log-transformed metabolite abundances in the SALK_0003718 and combined WtCol03 samples in experiment ME#3. Each point on the plot is an individual metabolite. Hyperaccumulation and hypoaccumulation patterns of the metabolites are seen through points that are far to the right or left of the central vertical line, respectively. An investigator may click any point on the plot to be advanced to the metabolite details page for that specific metabolite. In the example, the investigator clicked Met (contained in red circle) and was advanced to the metabolite details page for Met (Fig. 4). [See online article for color version of this figure.]
Figure 4.
Figure 4.
Metabolite details of Met. An investigator may click on the AraCyc and KEGG links to see metabolite annotations in those databases. The pathway entry shows all the pathways that are impacted by this metabolite and clicking on any pathway name links to AraCyc in the Plant Metabolic Network. Clicking on the List button after a pathway name shows experimental data for all the other metabolites in that pathway. The bar graph shows the abundance of Met in different Arabidopsis mutant lines. All replicates of the same mutant are grouped together for easier outlier detection. Under SALK_003718, the first replicate has unusually high abundance of Met, which signifies that one of the replicates might be an outlier. [See online article for color version of this figure.]
Figure 5.
Figure 5.
Replicate quality check: The numbers in boldface are the correlation coefficients between the three replicates in experiment ME#3 for the amino acids platform. Numbers close to one mean that the replicates were consistent. The bottom left triangle shows how the replicates compare using a scatterplot of the log2 values. Replicates 1 and 2 have a lower correlation coefficient than the other replicates. The zeros along the axes show imputed values where the metabolite was not detected. [See online article for color version of this figure.]

Similar articles

Cited by

References

    1. Altman DG, Bland JM. (1983) Measurement in medicine: the analysis of method comparison studies. Statistician 32: 307–317
    1. Bino RJ, Hall RD, Fiehn O, Kopka J, Saito K, Draper J, Nikolau BJ, Mendes P, Roessner-Tunali U, Beale MH, et al. (2004) Potential of metabolomics as a functional genomics tool. Trends Plant Sci 9: 418–425 - PubMed
    1. Caspi R, Foerster H, Fulcher CA, Kaipa P, Krummenacker M, Latendresse M, Paley S, Rhee SY, Shearer AG, Tissier C, et al. (2008) The MetaCyc database of metabolic pathways and enzymes and the BioCyc collection of pathway/genome databases. Nucleic Acids Res 36: D623–631 - PMC - PubMed
    1. Cui Q, Lewis IA, Hegeman AD, Anderson ME, Li J, Schulte CF, Westler WM, Eghbalnia HR, Sussman MR, Markley JL. (2008) Metabolite identification via the Madison Metabolomics Consortium Database. Nat Biotechnol 26: 162–164 - PubMed
    1. Degtyarenko K, de Matos P, Ennis M, Hastings J, Zbinden M, McNaught A, Alcantara R, Darsow M, Guedj M, Ashburner M. (2008) ChEBI: a database and ontology for chemical entities of biological interest. Nucleic Acids Res 36: D344–D350 - PMC - PubMed

Publication types

LinkOut - more resources