. 2010 Feb 10;30(6):2007-16.
doi: 10.1523/JNEUROSCI.4378-09.2010.

Interaction between facilitation and depression at a large CNS synapse reveals mechanisms of short-term plasticity

Affiliations

Interaction between facilitation and depression at a large CNS synapse reveals mechanisms of short-term plasticity

Martin Müller et al. J Neurosci. .

Abstract

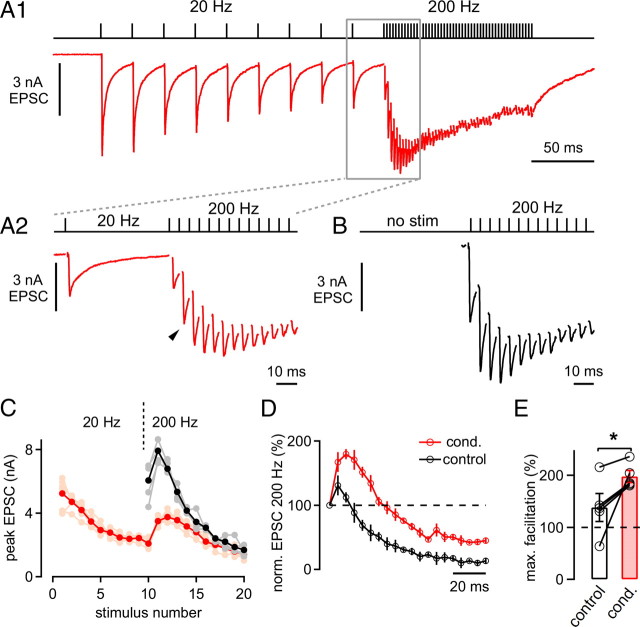
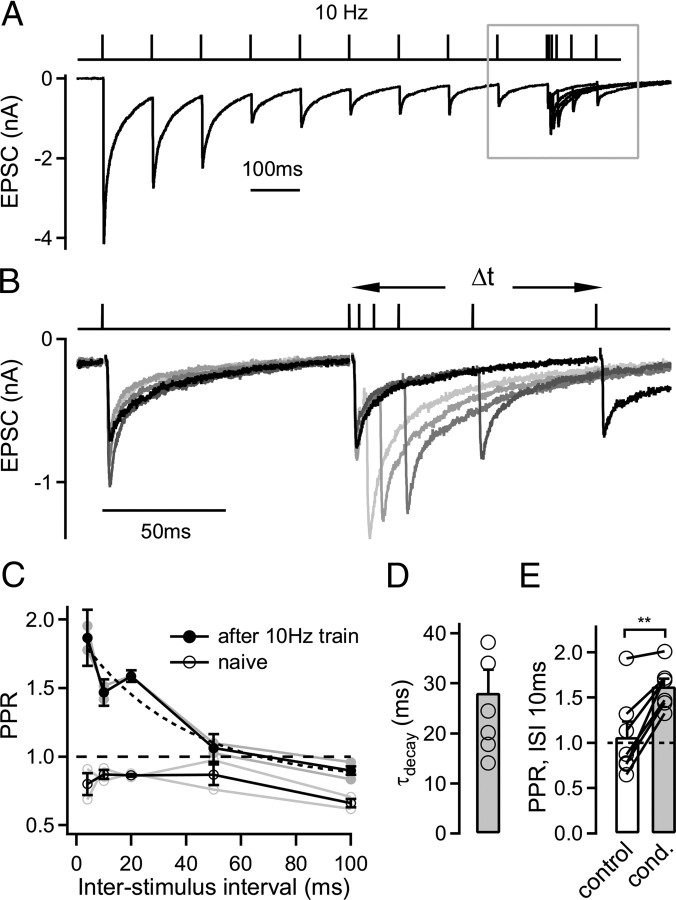
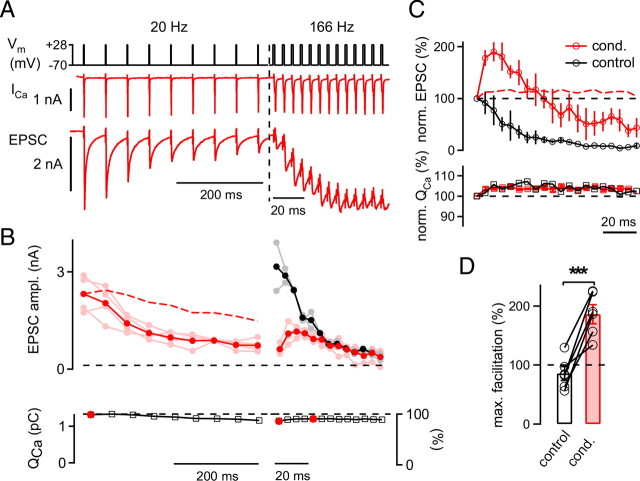
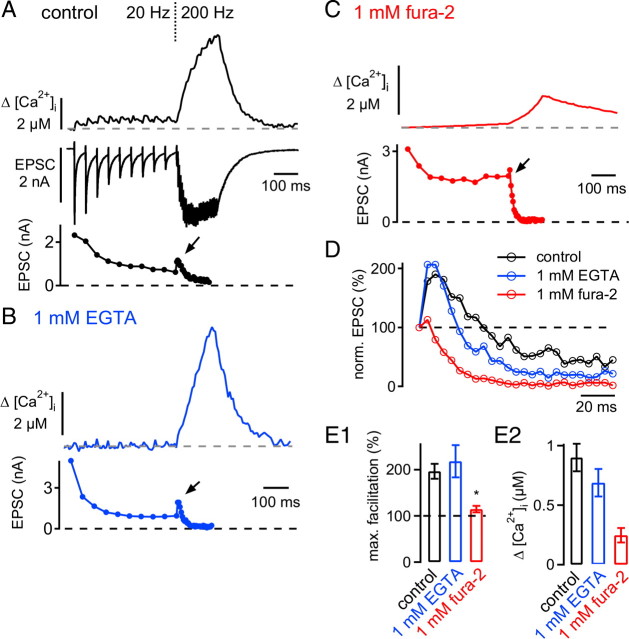
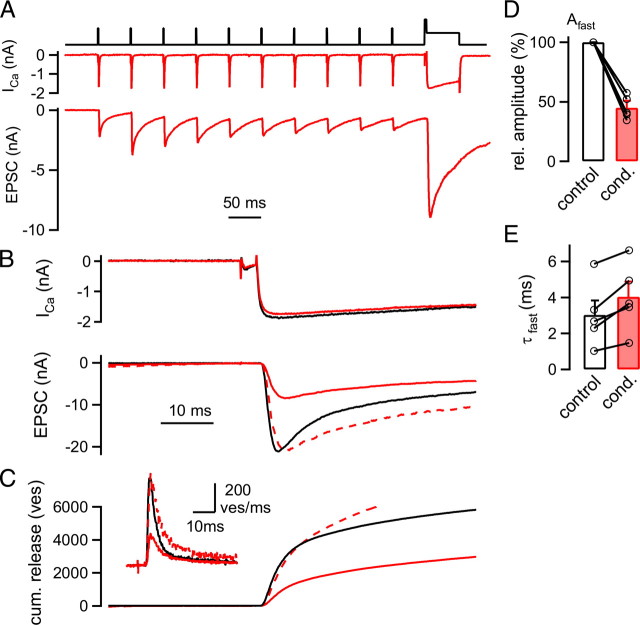
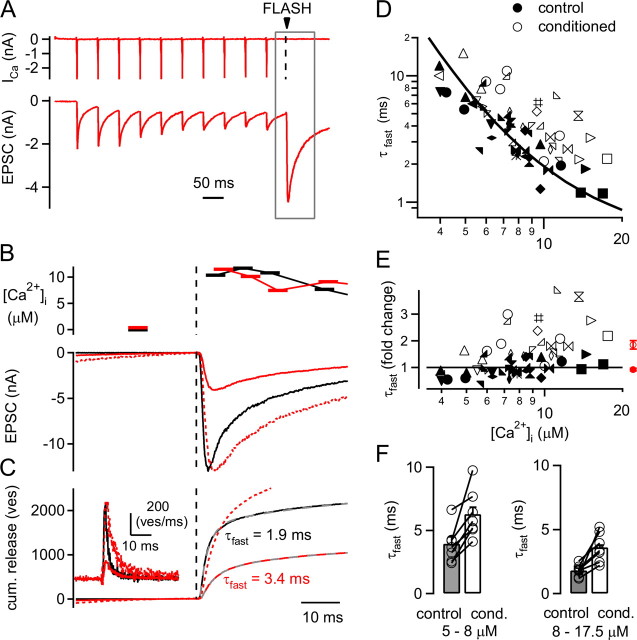
The two fundamental forms of short-term plasticity, short-term depression and facilitation, coexist at most synapses, but little is known about their interaction. Here, we studied the interplay between short-term depression and facilitation at calyx of Held synapses. Stimulation at a "low" frequency of 10 or 20 Hz, which is in the range of the spontaneous activity of these auditory neurons in vivo, induced synaptic depression. Surprisingly, an instantaneous increase of the stimulation frequency to 100 or 200 Hz following the low-frequency train uncovered a robust facilitation of EPSCs relative to the predepressed amplitude level. This facilitation decayed rapidly ( approximately 30 ms) and depended on presynaptic residual Ca(2+), but it was not caused by Ca(2+) current facilitation. To probe the release probability of the remaining readily releasable vesicles following the low-frequency train we made presynaptic Ca(2+) uncaging experiments in the predepressed state of the synapse. We found that low-frequency stimulation depletes the fast-releasable vesicle pool (FRP) down to approximately 40% of control and that the remaining FRP vesicles are released with approximately 2-fold slower release kinetics, indicating a hitherto unknown intrinsic heterogeneity among FRP vesicles. Thus, vesicles with an intrinsically lower release probability predominate after low frequency stimulation and undergo facilitation during the onset of subsequent high-frequency trains. Facilitation in the predepressed state of the synapse might help to stabilize the amount of transmitter release at the onset of high-frequency firing at these auditory synapses.


Figures

Figure 1.
Figure 1.
Facilitation in the predepressed state of the synapse. A, EPSCs in response to 10 afferent fiber stimuli applied at 20 Hz followed by 30 stimuli at 200 Hz. A2 shows the last EPSC during the low-frequency train and the beginning of the 200 Hz train (red trace) and corresponds to the boxed area in A1. Note the pronounced facilitation of EPSCs early during the 200 Hz train. B, EPSCs in response to a 200 Hz train applied without a preceding 20 Hz train after a stimulation pause of >45 s. C, Mean and individual EPSC amplitudes of the 200 Hz trains that were preceded by 20 Hz trains (red and pink symbols, respectively) and the control 200 Hz trains (black and gray symbols). D, Normalized (norm.) average peak EPSC amplitudes of 200 Hz trains under control conditions (without preceding stimulation; black symbols) and immediately following 20 Hz trains (red symbols). Note the robust and long-lasting net facilitation observed during the conditioned 200 Hz train. Data in A–D are from the same cell. E, Average maximal (max.) facilitation during control 200 Hz trains (open bar) and during conditioned (cond.) 200 Hz trains that immediately followed 20 Hz stimulation (red bar; n = 5 cells; p = 0.04).
Figure 2.
Figure 2.
Decay kinetics of facilitation in the predepressed state of the synapse. A, The EPSC in response to a paired-pulse protocol that consisted of a 10 Hz train of 10 stimuli to predepress the synapse, followed by an 11th stimulus given at variable interpulse intervals (5–100 ms). B, The EPSC traces during the last stimulus at 10 Hz and during five different interstimulus intervals following the 10 Hz trains are shown at a higher time resolution (corresponding to the boxed area in A). C, Average paired-pulse ratio (PPR; peak EPSC 11/peak EPSC 10) following the 10 Hz conditioning train (filled symbols) and for control conditions without preceding stimulation (open symbols). The decay of facilitation in the predepressed state (filled symbols) was fitted with an exponential function with a time constant of 38 ms (dashed line). Data in A–C are from the same cell. D, Mean decay time constant of facilitation recorded from n = 6 cells. E, Average paired-pulse ratio (Δt = 10 ms) in response to two stimuli applied under control conditions (open bar, no preceding stimulation) or following the conditioning (cond.) 10 Hz train (gray bar). Note the significantly different paired-pulse ratio following 10 Hz trains (p = 0.0015; n = 7 cells).
Figure 3.
Figure 3.
Presynaptic Ca2+ current dynamics during facilitation in the predepressed state. A, Paired presynaptic and postsynaptic whole-cell recording (75 μm EGTA added to the presynaptic pipette solution). Presynaptic voltage-clamp protocol (top), presynaptic Ca2+ currents (ICa; middle), and EPSCs (bottom). Note the different time scales during the 20 Hz train and during the 166 Hz train. B, Average and individual peak EPSC amplitudes (ampl.) (top; dark and light symbols respectively) in response to the sequence of 20 Hz train followed by a high-frequency train (red) and to the control high-frequency trains (black). The bottom panel shows the average Ca2+ current integrals (QCa) during the conditioned high-frequency train. The dashed red trace (top) shows the depression of EPSCs predicted by the measured Ca2+ currents (calculated as the 3.5th power of the relative QCa; see Results). Note that Ca2+ current inactivation fails to predict the full magnitude of the observed EPSC depression. C, Average EPSC amplitudes (top) and Ca2+ current charge values (bottom) for the conditioned 200 Hz trains (red) and the control 200 Hz trains (black) normalized to the first response at 200 Hz. Note that the Ca2+ current facilitation time courses were very similar for control and conditioned 200 Hz trains, whereas the short-term plasticity behavior differed considerably. The red dashed line shows the EPSC facilitation predicted by Ca2+ current facilitation. D, Average maximal (max.) facilitation during control 200 Hz trains (open bar) and during conditioned (cond.) 200 Hz trains (red bar; n = 6 cell pairs; p < 0.001).
Figure 4.
Figure 4.
Facilitation in the predepressed state depends on presynaptic residual Ca2+. A, Presynaptic spatially averaged [Ca2+]i imaged by the low-affinity Ca2+ indicator fura-6F (top; average of n = 4 traces), EPSCs (middle), and average peak EPSC amplitudes (bottom) in response to presynaptic voltage-clamp stimulation (10 stimuli at 20 Hz, followed by 30 stimuli at 200 Hz). The presynaptic solution contained 100 μm fura-6F and 75 μm EGTA. B, C, Presynaptic spatially averaged [Ca2+]I (top) and average EPSC amplitudes (bottom) in response to the same stimulation protocol as in A. The presynaptic solution now contained 100 μm fura-6F and 1 mm EGTA (B) or 1 mm fura-2 (C). D, Normalized (norm.) average peak EPSC amplitudes during the conditioned 200 Hz train for the recordings shown in A–C. Note the nearly complete absence of facilitation in the presence of the BAPTA-like Ca2+ buffer fura-2. E1, E2, Average maximal (max.) facilitation (E1) and average [Ca2+]i increase measured at the point of maximal facilitation during the 200 Hz train (Δ[Ca2+]i) (E2). Black bars: 75 μm EGTA and fura-6F (n = 6 paired recordings); blue bars: 1 mm EGTA and fura-6F (n = 3 pairs); red bars: 1 mm fura-2 (n = 5 pairs). Note that both the maximal facilitation and the increase in spatially averaged [Ca2+]i were significantly smaller with 1 mm fura-2 as compared with the two other conditions.
Figure 5.
Figure 5.
A slowing of the release kinetics of FRP vesicles (ves) following low frequency stimulation. A, Presynaptic Ca2+ currents (ICa; middle) and EPSCs (bottom) elicited by a 20 Hz train of presynaptic depolarizations to +28 mV followed by a long depolarization (to +80 mV for 3 ms and to 0 mV for 50 ms; top). B, Presynaptic Ca2+ currents (top) and EPSCs (bottom) in response to a long depolarization that was preceded by a 20 Hz train (red traces) and to a control depolarization given in the naive state (black traces). Note that the predepressed EPSC rose more slowly than the control EPSC, as seen from the peak-scaled trace (red dashed trace; bottom). C, Transmitter release rates (inset) obtained from the deconvolution of the EPSCs shown in B and integrated release rates [cumulative (cum.) release]. Cumulative release traces were fitted with double exponential fits (data not shown). Traces in A–C are from the same recording. D, Average amplitude of the fast release component (Afast) following 20 Hz stimulation (red bar), normalized to the control response obtained in each pair (white bar; n = 5 cell pairs; p < 0.001). E, Average time constants (τfast) of the fast release component following 20 Hz trains (red bar) and under control conditions (black bar; n = 5 pairs).
Figure 6.
Figure 6.
Ca2+ uncaging reveals a decreased intrinsic release kinetics of the remaining FRP vesicles (ves). A, Presynaptic Ca2+ currents (ICa; top), and EPSCs (bottom) in response to a 20 Hz train followed by Ca2+ uncaging. B, Presynaptic [Ca2+]i as imaged by fura-2FF (top) and EPSCs (bottom) in response to a flash applied to the naive synapse (black traces) and to the predepressed synapse (red traces). The predepressed EPSC was scaled to the peak of the naive EPSC (dashed red trace; note the slower rise phase of the predepressed EPSC). C, Transmitter release rates (inset) and cumulative (cum.) release traces of the EPSCs shown in B. Double exponential fits of the cumulative release traces are shown as gray dashed lines. Note the slower time constant of the fast release component (τfast) despite the similar post-flash [Ca2+]i step obtained in these examples (see B). The cumulative release trace following the 20 Hz train was scaled (see red dashed trace) to match the amplitude of the fast release component (Afast) under control conditions. D, Plot of the fast release time constants obtained from double exponential fits to cumulative release traces evoked by Ca2+ uncaging (see C). Time constants of control flash responses and flashes following the conditioning 20 Hz train are shown as filled and open symbols, respectively. The relationship between fast time constants and [Ca2+]i in response to control flashes was fitted with a one-pool model of Ca2+ binding and vesicle fusion (black line; see Materials and Methods). The x-axis plots [Ca2+]i (in μm) as in E. E, Plot of the fold change between the fast release time constants and the fit to the control data of the fast release time constants. Note that while the control data (filled symbols) fluctuate around a value of 1 as expected (filled symbols), the τfast values following the 20 Hz trains (open symbols) show a robust ∼1.5–2 fold slowing. The average values of all relative τfast values are shown as red average symbols for the control data and following the 20 Hz trains (red closed and open symbols, respectively). F, Average fast-time constants (n = 7 cell pairs) separated for two ranges of postflash [Ca2+]i values (left, 5–8 μm; right, 8 – 17.5 μm), both under control conditions (gray bars), and following 20 Hz trains (open bars). Note the significant slowing of τfast for all paired comparisons (p = 0.002 and 0.01 for 5–8 and 8–17.5 μm [Ca2+]i, respectively).

Similar articles

Cited by

References

    1. Atluri PP, Regehr WG. Determinants of the time course of facilitation at the granule cell to Purkinje cell synapse. J Neurosci. 1996;16:5661–5671. - PMC - PubMed
    1. Betz WJ. Depression of transmitter release at the neuromuscular junction of the frog. J Physiol. 1970;206:629–644. - PMC - PubMed
    1. Blatow M, Caputi A, Burnashev N, Monyer H, Rozov A. Ca2+ buffer saturation underlies paired pulse facilitation in calbindin-D28k-containing terminals. Neuron. 2003;38:79–88. - PubMed
    1. Borst JG, Helmchen F, Sakmann B. Pre- and postsynaptic whole-cell recordings in the medial nucleus of the trapezoid body of the rat. J Physiol. 1995;489:825–840. - PMC - PubMed
    1. Boudkkazi S, Carlier E, Ankri N, Caillard O, Giraud P, Fronzaroli-Molinieres L, Debanne D. Release-dependent variations in synaptic latency: a putative code for short- and long-term synaptic dynamics. Neuron. 2007;56:1048–1060. - PubMed

Publication types

LinkOut - more resources