. 2010 Feb 10;30(6):2088-101.
doi: 10.1523/JNEUROSCI.3785-09.2010.

CSF biomarkers in prediction of cerebral and clinical change in mild cognitive impairment and Alzheimer's disease

Affiliations

CSF biomarkers in prediction of cerebral and clinical change in mild cognitive impairment and Alzheimer's disease

Anders M Fjell et al. J Neurosci. .

Abstract

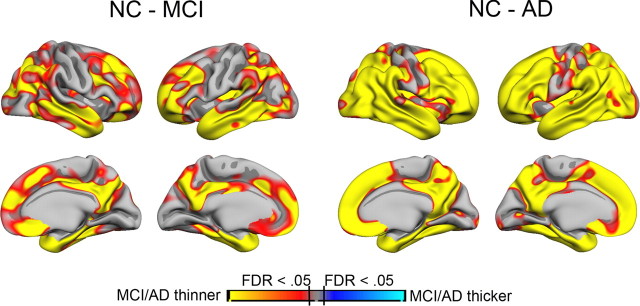
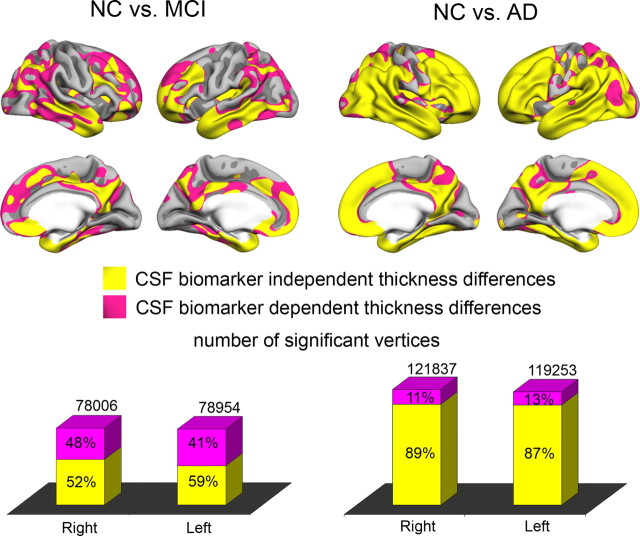
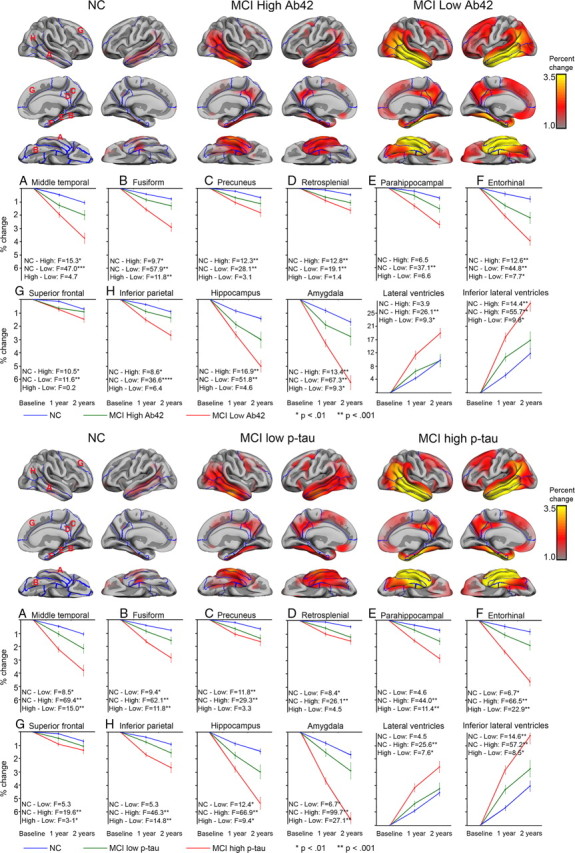
Brain atrophy and altered CSF levels of amyloid beta (Abeta(42)) and the microtubule-associated protein tau are potent biomarkers of Alzheimer's disease (AD)-related pathology. However, the relationship between CSF biomarkers and brain morphometry is poorly understood. Thus, we addressed the following questions. (1) Can CSF biomarker levels explain the morphometric differences between normal controls (NC) and patients with mild cognitive impairment (MCI) or AD? (2) How are CSF biomarkers related to atrophy across the brain? (3) How closely are CSF biomarkers and morphometry related to clinical change [clinical dementia rating sum of boxes (CDR-sb)]? Three hundred seventy participants (105 NC, 175 MCI, 90 AD) from the Alzheimer's Disease Neuroimaging Initiative were studied, of whom 309 were followed for 1 year and 176 for 2 years. Analyses were performed across the entire cortical surface, as well as for 30 cortical and subcortical regions of interest. Results showed that CSF biomarker levels could not account for group differences in brain morphometry at baseline but that CSF biomarker levels showed moderate relationships to longitudinal atrophy rates in numerous brain areas, not restricted to medial temporal structures. Baseline morphometry was at least as predictive of atrophy as were CSF biomarkers. Even MCI patients with levels of Abeta(42) comparable with controls and of p-tau lower than controls showed more atrophy than the controls. Morphometry predicted change in CDR-sb better than did CSF biomarkers. These results indicate that morphometric changes in MCI and AD are not secondary to CSF biomarker changes and that the two types of biomarkers yield complementary information.


Figures

Figure 1.
Figure 1.
Cortical regions of interest. Fifteen automatically defined gyral-based cortical regions were selected for additional analyses. These are shown on the semi-inflated surface of the template brain to which all individual brains were registered.
Figure 2.
Figure 2.
Cortical thickness differences between NC and MCI/AD patients. Cortical thickness was compared point by point across the entire cortical mantle between NC and MCI patients and between NC and AD patients. Sex and age were used as covariates. The results are shown as p value maps, thresholded at FDR < 0.05. As can be seen, MCI patients have thinner cortex than NC in large cortical areas, including medial, lateral, and inferior temporal cortices, medial parietal cortex, and widespread areas in frontal cortex. The differences between NC and AD patients are even larger, covering the major part of the cortical surface, except the area around the central sulcus.
Figure 3.
Figure 3.
Cohen's D for baseline CSF measures and brain morphometry. The five CSF variables and the 30 morphometric regions of interests were compared between NC versus MCI and NC versus AD. Hippocampus and entorhinal cortex were the two variables that best distinguished the groups. The CSF measures also yielded large effects sizes. A large proportion of the variables had a Cohen's D exceeding 0.8, which is regarded as a large effect size. The error bars represent 95% confidence intervals. Please note that, although these give an indication of degree of uncertainty associated with the estimation of the mean of each variable, they cannot be used to make statistical inferences about the significance of effect size differences among the variables.
Figure 4.
Figure 4.
Effects of regressing out CSF variables on baseline thickness differences. The cortical thickness comparisons between the diagnostic groups (see Fig. 2) were repeated with t-tau, p-tau, and Aβ42 as covariates. The resulting p value maps from the group contrasts with and without the CSF biomarkers as covariates were binarized at p < 0.01 (FDR < 0.05) and color coded. A pink vertex indicates a significant difference in cortical thickness that did not survive when the CSF measures were entered as covariates, and a yellow vertex indicates a thickness difference that remained significant after entering the CSF measures as covariates. Large cortical areas showed significant differences in thickness even after the CSF measures were entered as covariates, indicating CSF-independent cortical thickness differences. The number of vertices surviving correction for CSF measures was substantially larger for the NC versus AD contrast compared with the NC versus MCI contrast attributable to the larger effect sizes in general in the latter analyses.
Figure 5.
Figure 5.
Prediction of 1 year cortical change from baseline cortical thickness in MCI. One year change in cortical volume in MCI was predicted from baseline cortical thickness point by point across the cortical surface, with age and sex used as covariates. The top shows uncorrected p values, and the bottom shows the p maps thresholded at FDR < 0.05. Thinner cortex at baseline was associated with a larger percentage decrease in cortical volume over 1 year. The corrected p maps indicate that this effect is larger in the right hemisphere. The uncorrected maps show that the left hemisphere has the same pattern of effects, but the p values were lower. Red–yellow colors indicate that thicker baseline cortex was related to less volume loss, and blue–green indicates the inverse relationship.
Figure 6.
Figure 6.
Prediction of 1 year cortical change from baseline CSF biomarker levels. One year change in cortical volume in MCI was predicted from baseline CSF biomarker values point by point across the cortical surface, with age and sex used as covariates. The top shows uncorrected p values, and the bottom shows the p maps thresholded at FDR < 0.05. Higher values of t-tau and lower values of Aβ42 at baseline were associated with a larger percentage decrease in cortical volume over 1 year (red–yellow colors). The corrected p maps indicate that this effect is somewhat larger in the left hemisphere for Aβ42. The uncorrected maps show that the right hemisphere has the same pattern of effects, but the p values were lower.
Figure 7.
Figure 7.
Rate of atrophy as a function of CSF p-tau or Aβ42. The MCI sample was split based on the median value of Aβ42 and p-tau. Rate of change was compared across high Aβ42, low Aβ42, and NC, as well as high p-tau, low p-tau, and NC. The MCI low Aβ42 group did not differ significantly in CSF levels of Aβ42 from the NC group, whereas the NC group had significantly higher CSF values of p-tau (see Results). Percentage cortical 2 year change was calculated for each point on the cortical surface and displayed on the semi-inflated template brain. In addition, mean change at 1 and 2 year were calculated for selected ROIs and plotted with SEs for each group. Mixed linear model analyses were run for two and two group contrasts, and the resulting F and p values are presented. As can be seen, for several ROIs, the MCI group with normal CSF values showed significantly larger 1 and 2 year change than the NC group and significantly smaller change compared with the MCI group with higher p tau or lower Aβ42 levels.

References

    1. Arriagada PV, Marzloff K, Hyman BT. Distribution of Alzheimer-type pathologic changes in nondemented elderly individuals matches the pattern in Alzheimer's disease. Neurology. 1992;42:1681–1688. - PubMed
    1. Braak H, Braak E. On areas of transition between entorhinal allocortex and temporal isocortex in the human brain. Normal morphology and lamina-specific pathology in Alzheimer's disease. Acta Neuropathol. 1985;68:325–332. - PubMed
    1. Buckner RL, Head D, Parker J, Fotenos AF, Marcus D, Morris JC, Snyder AZ. A unified approach for morphometric and functional data analysis in young, old, and demented adults using automated atlas-based head size normalization: reliability and validation against manual measurement of total intracranial volume. Neuroimage. 2004;23:724–738. - PubMed
    1. Chou YY, Leporé N, Avedissian C, Madsen SK, Parikshak N, Hua X, Shaw LM, Trojanowski JQ, Weiner MW, Toga AW, Thompson PM. Mapping correlations between ventricular expansion and CSF amyloid and tau biomarkers in 240 subjects with Alzheimer's disease, mild cognitive impairment and elderly controls. Neuroimage. 2009;46:394–410. - PMC - PubMed
    1. Craig-Schapiro R, Fagan AM, Holtzman DM. Biomarkers of Alzheimer's disease. Neurobiol Dis. 2009;35:128–140. - PMC - PubMed

Publication types

MeSH terms