. 2010 Feb 10;30(6):2177-87.
doi: 10.1523/JNEUROSCI.6030-09.2010.

Reevaluation of neurodegeneration in lurcher mice: constitutive ion fluxes cause cell death with, not by, autophagy

Affiliations

Reevaluation of neurodegeneration in lurcher mice: constitutive ion fluxes cause cell death with, not by, autophagy

Jun Nishiyama et al. J Neurosci. .

Abstract

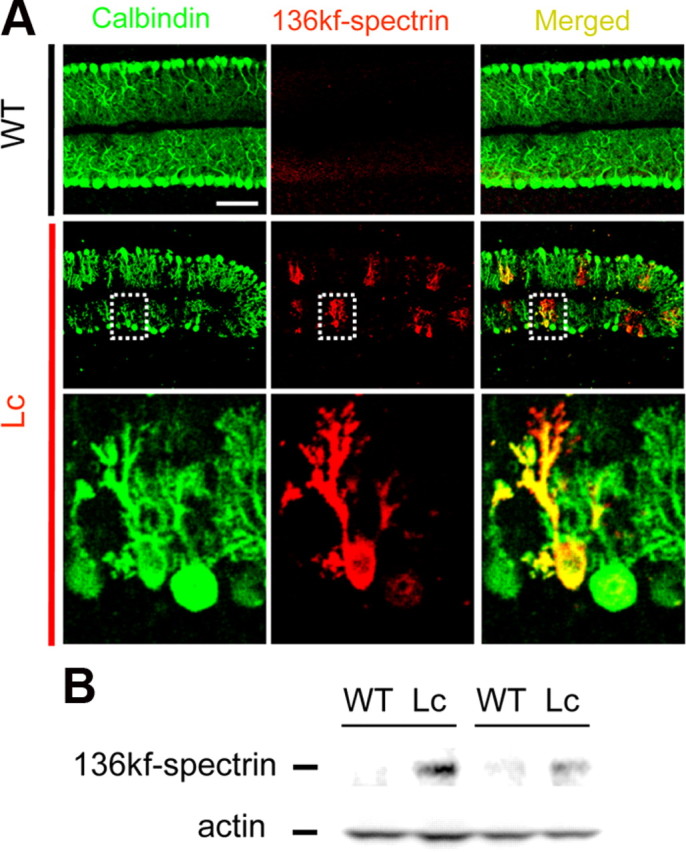
The lurcher (Lc) mice have served as a valuable model for neurodegeneration for decades. Although the responsible mutation was identified in genes encoding delta2 glutamate receptors (GluD2s), which are predominantly expressed in cerebellar Purkinje cells, how the mutant receptor (GluD2(Lc)) triggers cell death has remained elusive. Here, taking advantage of recent knowledge about the domain structure of GluD2, we reinvestigated Lc-mediated cell death, focusing on the "autophagic cell death" hypothesis. Although autophagy and cell death were induced by the expression of GluD2(Lc) in heterologous cells and cultured neurons, they were blocked by the introduction of mutations in the channel pore domain of GluD2(Lc) or by removal of extracellular Na(+). In addition, although GluD2(Lc) is reported to directly activate autophagy, mutant channels that are not associated with n-PIST (neuronal isoform of protein-interacting specifically with TC10)-Beclin1 still caused autophagy and cell death. Furthermore, cells expressing GluD2(Lc) showed decreased ATP levels and increased AMP-activated protein kinase (AMPK) activities in a manner dependent on extracellular Na(+). Thus, constitutive currents were likely necessary and sufficient to induce autophagy via AMPK activation, regardless of the n-PIST-Beclin1 pathway in vitro. Interestingly, the expression of dominant-negative AMPK suppressed GluD2(Lc)-induced autophagy but did not prevent cell death in heterologous cells. Similarly, the disruption of Atg5, a gene crucial for autophagy, did not prevent but rather aggravated Purkinje-cell death in Lc mice. Furthermore, calpains were specifically activated in Lc Purkinje cells. Together, these results suggest that Lc-mediated cell death was not caused by autophagy but necrosis with autophagic features both in vivo and in vitro.


Figures

Figure 1.
Figure 1.
Induction of autophagy and cell death in HEK293 cells expressing GluD2Lc. A, Schematic diagrams of GluD2wt and GluD2Lc. The numbers indicate transmembrane domains 1–4. In GluD2Lc, a point mutation in the third transmembrane domain (red star) turns the channel constitutively open and allows Na+ and Ca2+ flow into the cells (open arrow). The pink box at the C-terminal end indicates the C-terminal PDZ ligand region, which associates with Beclin1 via n-PIST. B, Representative fluorescence images of HEK293 cells expressing EGFP and either GluD2wt or GluD2Lc. C, Cell death induced by GluD2Lc. At 15 h after transfection, the number of EGFP-positive cells was counted and normalized by that in control cells (Cont.; mock transfected). Error bars indicate the mean ± SEM (from 3 independent experiments). D, Representative fluorescence images of HEK293 cells expressing EGFP-LC3 and either GluD2wt or GluD2Lc. E, Autophagosome formation induced by GluD2Lc. The number of EGFP-LC3 puncta, as a marker for autophagosomes, was counted in each cell coexpressing GluD2wt or GluD2Lc using the object detection algorithm (see Materials and Methods). Error bars indicate the mean + SEM (from at least 60 cells in 3 independent experiments). Scale bars: B, 100 μm; D, 10 μm.**p < 0.01.
Figure 2.
Figure 2.
Na+ influx, but not Ca2+, was necessary for Lc-mediated autophagy and cell death in HEK293 cells. A, Schematic diagrams of GluD2Lc and its channel-pore mutants. GluD2Lc-Q618R, in which arginine (R) was substituted for Q at the Q/R site, was impermeable to Ca2+. GluD2Lc-V617R, in which R was substituted for valine (V) at one position upstream of the Q/R site, prevented all ion flow through the channel. B, Autophagosome formation induced by GluD2Lc and channel-pore mutants. At 15 h after transfection, the number of EGFP-LC3 puncta, as a marker for autophagosomes, was counted in each cell expressing mock (Cont.), GluD2wt, GluD2Lc, GluD2Lc-Q618R, or GluD2Lc-V617R using the object detection algorithm. Error bars indicate the mean + SEM (from at least 60 cells in 3 independent experiments). C, Cell death induced by GluD2Lc and channel mutants. At 15 h after transfection, the number of EGFP-positive cells was counted and normalized by that in control cells (mock transfected). Error bars indicate the mean + SEM (from 3 independent experiments). D, E, Dependency of autophagosome formation and cell death on extracellular Na+ and Ca2+ concentrations. At 6 h after transfection, the culture medium was changed to artificial CSF containing various Na+ and Ca2+ concentrations. At 15 h after transfection, the numbers of EGFP-LC3 clusters (D) and surviving cells (E) were counted, as described above. Each point represents the mean ± SEM from three independent experiments. *p < 0.05; **p < 0.01.
Figure 3.
Figure 3.
Binding to n-PIST–Beclin1 is dispensable for Lc-mediated autophagy and cell death. A, Schematic diagrams of various receptors that do not associate with n-PIST–Beclin1. The pink box at the C-terminal end of GluD2Lc indicates the C-terminal PDZ ligand region, which associates with Beclin1 via n-PIST. The GluK2 subunit of kainate receptors became constitutively open when the Lc-like mutation was introduced to the corresponding region (GluK2Lc). Both wild-type GluK2 (GluK2wt) and GluK2Lc did not associate with n-PIST–Beclin1. Similarly, GluD2wt-ΔCT7 and GluD2Lc-ΔCT7 lacked the C-terminal 7 amino acids essential for binding to n-PIST–Beclin1. B, The C-terminal domain of GluD2 was not required for autophagy. HEK293 cells were cotransfected with cDNAs encoding EGFP-LC3 and mock (Cont.), GluK2wt, GluK2Lc, GluD2wt-ΔCT7, or GluD2Lc-ΔCT7. At 15 h after transfection, the number of EGFP-LC3 puncta was counted in each cell. Error bars indicate the mean + SEM (from at least 60 cells in 3 independent experiments). C, The C-terminal domain of GluD2 was not required for cell death. HEK293 cells were cotransfected with cDNAs encoding EGFP and mock (Cont.), GluK2wt, GluK2Lc, GluD2wt-ΔCT7, or GluD2Lc-ΔCT7. At 15 h after transfection, the number of EGFP-positive cells was counted and normalized by that in control cells (Cont.; mock transfected). Error bars indicate the mean + SEM (from 3 independent experiments). **p < 0.01.
Figure 4.
Figure 4.
Intracellular Ca2+ levels were not elevated in cells expressing GluD2Lc-Q618R. A, Representative pseudocolor images of cells loaded with fura-2. HEK293 cells expressing GluD2wt, GluD2Lc, or GluD2Lc-Q618R were loaded with fura-2 at the indicated time after transfection. The ratio of the fluorescence intensity excited at 340 nm (F340) to that excited at 380 (F380) was shown in pseudocolor; high Ca2+ levels are shown in red, and low Ca2+ levels are shown in blue. B, Intracellular Ca2+ levels are elevated in cells expressing GluD2Lc, but not in cells expressing GluD2wt or GluD2Lc-Q618R. Error bars represent the mean F340/F380 ratio + SEM (n > 60 cells from 3 independent experiments). Note that cells expressing GluD2Lc-Q618R did not show increased intracellular Ca2+ levels at any time point, but all these cells eventually died (Fig. 2). Scale bar, 100 μm. **p < 0.01.
Figure 5.
Figure 5.
Phosphorylation of AMPK mediates autophagy induced by GluD2Lc. A, B, Immunoblot analysis of the phosphorylation of AMPK. HEK293 cells expressing GluD2wt [wild type (WT)] or GluD2Lc (Lc) were collected at the indicated time after transfection and were subjected to an immunoblot analysis using anti-AMPKα, anti-phospho-Thr172, and anti-LC3 antibodies. The phosphorylated form of AMPK was increased in cells expressing GluD2Lc at 9 h after transfection before the detection of an increase in the LC3-II level at 15 h. Nontransfected cells were used as a negative control (N). Cells treated with 5 μg/ml of oligomycin and serum starvation were used as a positive control (P). B, Quantitative analysis of immunoblot assay. The mean band intensity ratios of phospho-AMPK to AMPK (left panel) and of LC3-II to LC3-I (right panel) from cells expressing GluD2wt at 9 h were established as 100%. Error bars represent the mean + SEM (from at least 6 independent experiments). C, D, Expression of dominant-negative AMPK inhibited GluD2Lc-induced autophagy. HEK293 cells coexpressing dominant-negative AMPK (AMPK-DN) and GluD2wt or GluD2Lc were subjected to an immunoblot analysis using anti-LC3 antibody. The mean band intensity ratio of LC3-II to LC3-I from cells coexpressing mock cDNA and GluD2wt was established as 100% (D). Error bars represent the mean + SEM (from 6 independent experiments). E, Expression of dominant-negative AMPK did not rescue GluD2Lc-induced cell death. HEK293 cells were cotransfected with cDNAs encoding EGFP, AMPK-DN (or mock), and GluD2wt (or GluD2Lc). At 15 h after transfection, the number of EGFP-positive cells was counted and normalized by that in cells expressing EGFP, mock, and GluD2wt. Error bars indicate the mean + SEM (from 3 independent experiments). *p < 0.05; **p < 0.01.
Figure 6.
Figure 6.
Induction of autophagy, axonal degeneration, and cell death in neurons by GluD2Lc and various mutants. A, Representative fluorescent images of EGFP-LC3 and mCherry in neurons. Cultured hippocampal neurons at 12 DIV were transfected with cDNAs encoding EGFP-LC3, mCherry, and one of GluD2wt, GluD2Lc, GluD2Lc-Q618R, GluD2Lc-V617R, GluD2wt-ΔCT7, or GluD2Lc-ΔCT7 and then analyzed after 15 h. Note that EGFP-LC3 clusters were observed in the cell bodies of neurons expressing GluD2Lc, GluD2Lc-Q618R, or GluD2Lc-ΔCT7. B, Survival of neurons expressing GluD2Lc and various mutants. At 15 h after transfection, the number of mCherry-positive neurons was counted and normalized by that in neurons expressing GluD2wt. Error bars indicate the mean + SEM (from 5 independent experiments). C, Representative fluorescent images of axons of hippocampal neurons expressing GluD2Lc, GluD2Lc-Q618R, or GluD2Lc-ΔCT7. Cultured hippocampal neurons were transfected with cDNAs encoding mCherry and GluD2wt or GluD2 mutants as indicated, and then stained for the dendritic marker MAP2 (green) and the axonal marker tau-1 (blue). The regions indicated by the white boxes are enlarged in the right panels. Note that marked focal swellings were observed along the MAP2-negative and tau-1-positive axons of hippocampal neurons expressing GluD2Lc, GluD2Lc-Q618R, and GluD2Lc-ΔCT7. White arrows and arrowheads indicate the axons. Scale bars: A, 10 μm; C, 100 μm. **p < 0.01.
Figure 7.
Figure 7.
Lc-mediated cell death was aggravated on an Atg5-null background in vivo. A, Abnormal footprint patterns of Lc/+ mice on an Atg5-null background at P21. The gait patterns of Lc/+; Atg5flox/flox mice (middle) were similarly ataxic to those of Lc/+; Atg5flox/flox; pcp2-Cre Lc/+ mice (right), compared to those of +/+; Atg5flox/flox mice (left). B, Morphology of cerebellum of Lc/+ mice on an Atg5-null background at P21. Representative gross morphology (top panels) and immunohistochemical analysis of parasagittal sections of cerebellum using anti-calbindin antibody (middle, cerebellar cortex; bottom, DCN region) are shown. The arrows in the bottom panels represent the swollen axons of Purkinje cells in the DCN region. Scale bars: Middle panels, 50 μm; bottom panels, 100 μm. C, Quantification of surviving Purkinje cells at P10 and P21. The number of Purkinje cells was counted along the Purkinje cell layer in confocal optical sections. The values represent the mean + SEM from at least three slices from two animals. D, Quantification of the axon swellings of Purkinje cells at P10 and P21. The degree of axon swellings was quantified by measuring the total area that stained double immunopositive for calbindin and synaptophysin in the DCN region. The values represent the mean + SEM from at least three slices from two animals. **p < 0.01. n. s., Not significant.
Figure 8.
Figure 8.
Cleavage of spectrin by calpains in Lc mice in vivo. A, Immunohistochemical studies. At P14, parasagittal sections of wild-type (WT) and Lc cerebellum were immunostained for calbindin (green) and 136 kDa fragment of α-spectrin cleaved by calpain (136 kf-spectrin; red). The regions indicated by the white boxes are enlarged in the bottom panels. Scale bar, 100 μm. B, Immunoblot analysis of 136 kf-spectrin. Cerebellar extracts from the WT and Lc mice at P14 were separated by SDS-PAGE, blotted onto polyvinyldene disulfide membrane, and subjected to an immunoblot analysis using anti-136 kf-spectrin and anti-actin antibodies. Two independent samples for each genotype were analyzed.

Similar articles

Cited by

References

    1. Ames A., 3rd CNS energy metabolism as related to function. Brain Res Brain Res Rev. 2000;34:42–68. - PubMed
    1. Bangalore R, Mehrke G, Gingrich K, Hofmann F, Kass RS. Influence of L-type Ca channel alpha 2/delta-subunit on ionic and gating current in transiently transfected HEK 293 cells. Am J Physiol. 1996;270:H1521–H1528. - PubMed
    1. Barros LF, Hermosilla T, Castro J. Necrotic volume increase and the early physiology of necrosis. Comp Biochem Physiol A Mol Integr Physiol. 2001;130:401–409. - PubMed
    1. Boland B, Kumar A, Lee S, Platt FM, Wegiel J, Yu WH, Nixon RA. Autophagy induction and autophagosome clearance in neurons: relationship to autophagic pathology in Alzheimer's disease. J Neurosci. 2008;28:6926–6937. - PMC - PubMed
    1. Borsello T, Croquelois K, Hornung JP, Clarke PG. N-methyl-d-aspartate-triggered neuronal death in organotypic hippocampal cultures is endocytic, autophagic and mediated by the c-Jun N-terminal kinase pathway. Eur J Neurosci. 2003;18:473–485. - PubMed

Publication types

MeSH terms

LinkOut - more resources