

Serotonin modulates fast-spiking interneuron and synchronous activity in the rat prefrontal cortex through 5-HT1A and 5-HT2A receptors
- PMID: 20147548
- PMCID: PMC6634052
- DOI: 10.1523/JNEUROSCI.3335-09.2010
Serotonin modulates fast-spiking interneuron and synchronous activity in the rat prefrontal cortex through 5-HT1A and 5-HT2A receptors
Abstract
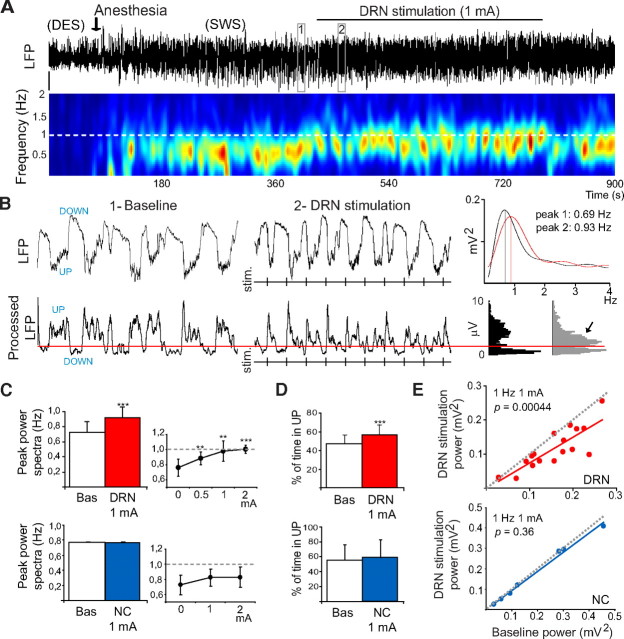
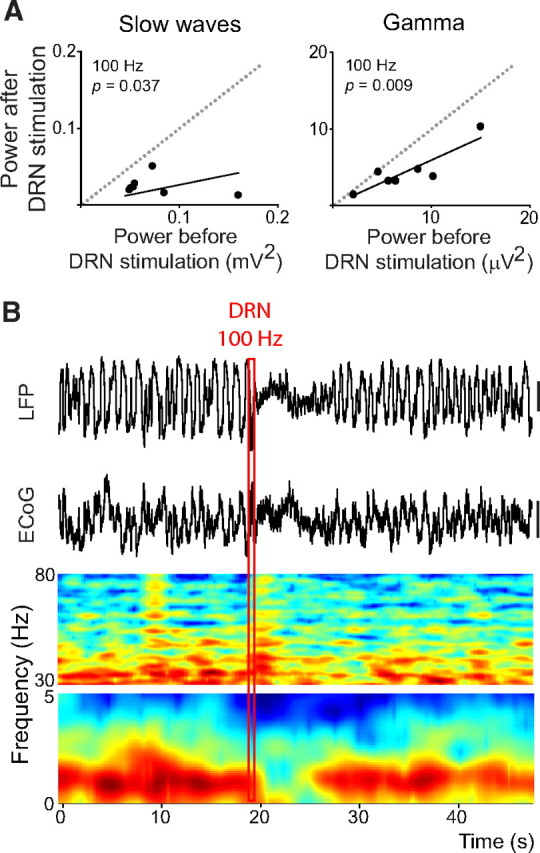
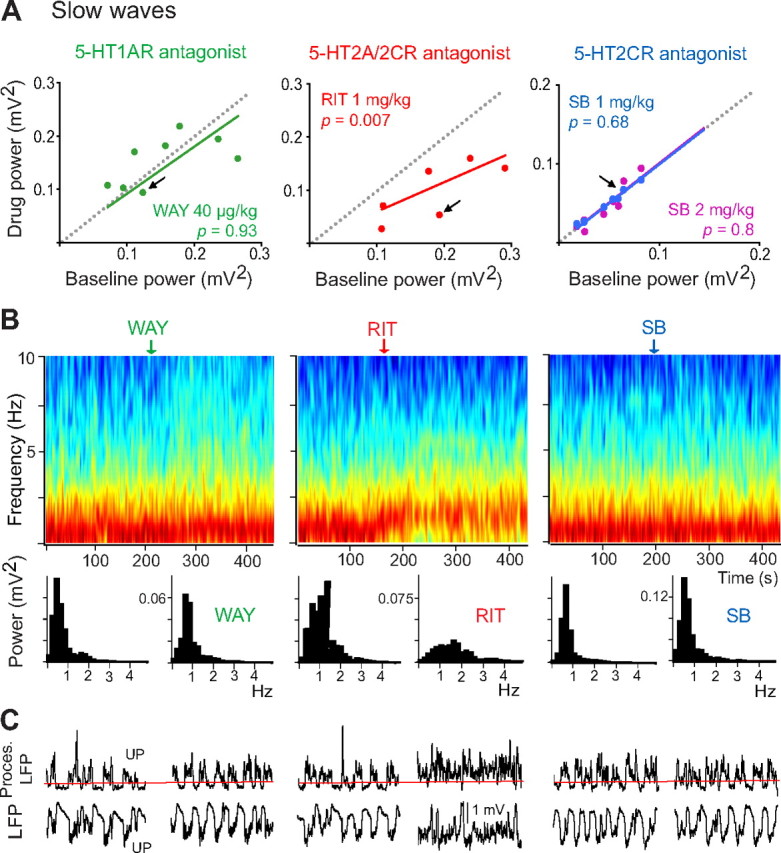
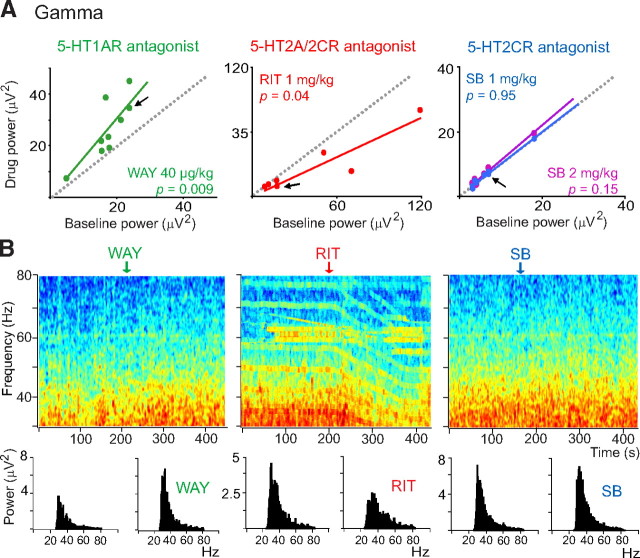
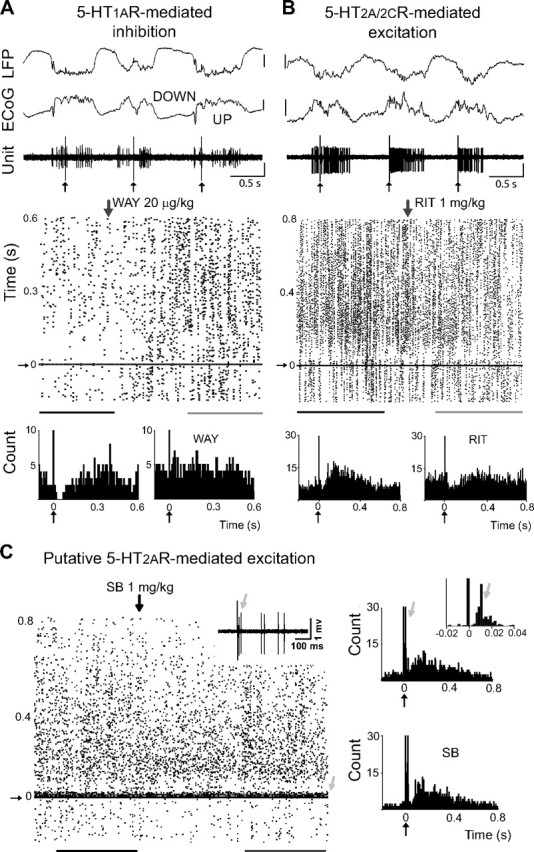
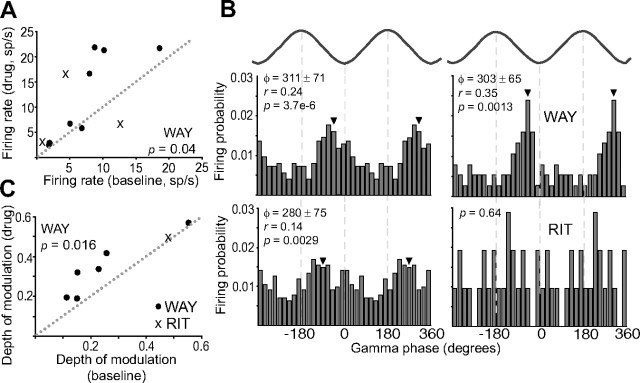
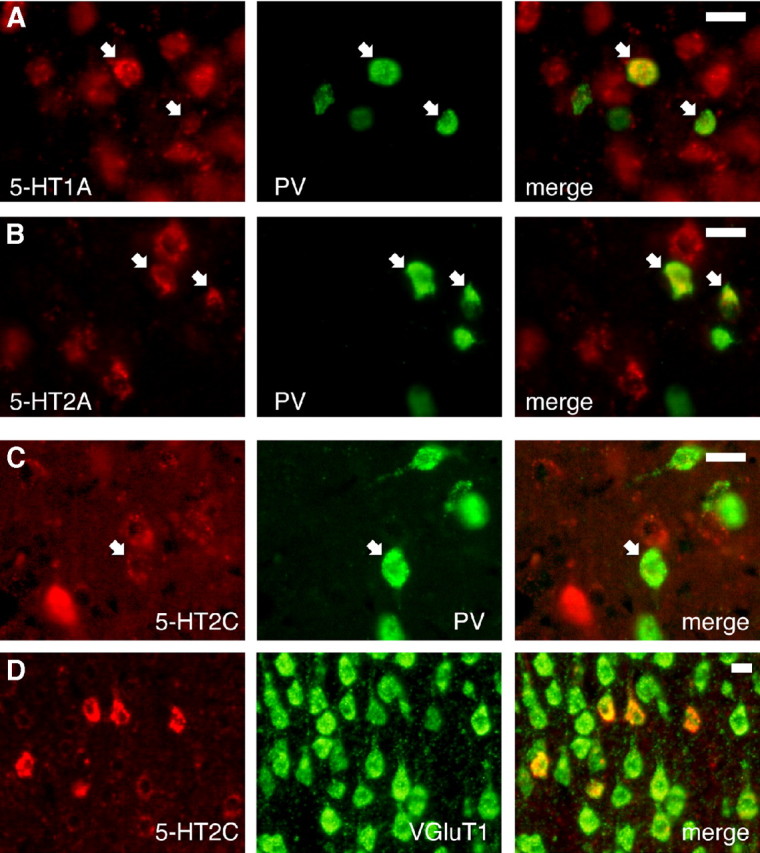
Alterations of the serotonergic system in the prefrontal cortex (PFC) are implicated in psychiatric disorders such as schizophrenia and depression. Although abnormal synchronous activity is observed in the PFC of these patients, little is known about the role of serotonin (5-HT) in cortical synchrony. We found that 5-HT, released by electrical stimulation of the dorsal raphe nucleus (DRN) in anesthetized rats, regulates the frequency and the amplitude of slow (<2 Hz) waves in the PFC via 5-HT(2A) receptors (5-HT(2A)Rs). 5-HT also modulates prefrontal gamma (30-80 Hz) rhythms through both 5-HT(1A)Rs and 5-HT(2A)Rs, but not 5-HT(2C)Rs, inducing an overall decrease in the amplitude of gamma oscillations. Because fast-spiking interneurons (FSi) are involved in the generation of gamma waves, we examined serotonergic modulation of FSi activity in vivo. Most FSi are inhibited by serotonin through 5-HT(1A)Rs, while a minority is activated by 5-HT(2A)Rs, and not 5-HT(2C)Rs. In situ hybridization histochemistry confirmed that distinct populations of FSi in the PFC express 5-HT(1A)Rs and 5-HT(2A)Rs, and that the number of FSi expressing 5-HT(2C)Rs is negligible. We conclude that 5-HT exerts a potent control on slow and gamma oscillations in the PFC. On the one hand, it shapes the frequency and amplitude of slow waves through 5-HT(2A)Rs. On the other hand, it finely tunes the amplitude of gamma oscillations through 5-HT(2A)R- and 5-HT(1A)R-expressing FSi, although it primarily downregulates gamma waves via the latter population. These results may provide insight into impaired serotonergic control of network activity in psychiatric illnesses such as schizophrenia and depression.
Figures
Similar articles
-
Co-expression and in vivo interaction of serotonin1A and serotonin2A receptors in pyramidal neurons of prefrontal cortex.Cereb Cortex. 2004 Mar;14(3):281-99. doi: 10.1093/cercor/bhg128. Cereb Cortex. 2004. PMID: 14754868
-
Postnatal fluoxetine-evoked anxiety is prevented by concomitant 5-HT2A/C receptor blockade and mimicked by postnatal 5-HT2A/C receptor stimulation.Biol Psychiatry. 2014 Dec 1;76(11):858-68. doi: 10.1016/j.biopsych.2013.11.005. Epub 2013 Nov 11. Biol Psychiatry. 2014. PMID: 24315410
-
Dopamine release induced by atypical antipsychotics in prefrontal cortex requires 5-HT(1A) receptors but not 5-HT(2A) receptors.Int J Neuropsychopharmacol. 2010 Nov;13(10):1299-314. doi: 10.1017/S146114571000009X. Epub 2010 Feb 17. Int J Neuropsychopharmacol. 2010. PMID: 20158933 Free PMC article.
-
Serotonin control of sleep-wake behavior.Sleep Med Rev. 2011 Aug;15(4):269-81. doi: 10.1016/j.smrv.2010.11.003. Epub 2011 Apr 2. Sleep Med Rev. 2011. PMID: 21459634 Review.
-
Studies on the neuroendocrine role of serotonin.Dan Med Bull. 2007 Nov;54(4):266-88. Dan Med Bull. 2007. PMID: 18208678 Review.
Cited by
-
Dysregulated neuromodulation in the anterior cingulate cortex in chronic pain.Front Pharmacol. 2023 Oct 25;14:1289218. doi: 10.3389/fphar.2023.1289218. eCollection 2023. Front Pharmacol. 2023. PMID: 37954846 Free PMC article. Review.
-
Modulation of neural oscillations in escitalopram treatment: a Canadian biomarker integration network in depression study.Transl Psychiatry. 2024 Oct 12;14(1):432. doi: 10.1038/s41398-024-03110-8. Transl Psychiatry. 2024. PMID: 39396045 Free PMC article.
-
Htr2a Gene and 5-HT(2A) Receptor Expression in the Cerebral Cortex Studied Using Genetically Modified Mice.Front Neurosci. 2010 Aug 13;4:36. doi: 10.3389/fnins.2010.00036. eCollection 2010. Front Neurosci. 2010. PMID: 20802802 Free PMC article.
-
Dissecting the Functional Organization of the C. elegans Serotonergic System at Whole-Brain Scale.bioRxiv [Preprint]. 2023 Jan 18:2023.01.15.524132. doi: 10.1101/2023.01.15.524132. bioRxiv. 2023. Update in: Cell. 2023 Jun 8;186(12):2574-2592.e20. doi: 10.1016/j.cell.2023.04.023. PMID: 36711891 Free PMC article. Updated. Preprint.
-
Dysfunctional brain networks and genetic risk for schizophrenia: specific neurotransmitter systems.CNS Neurosci Ther. 2011 Apr;17(2):89-96. doi: 10.1111/j.1755-5949.2010.00223.x. Epub 2010 Dec 28. CNS Neurosci Ther. 2011. PMID: 21199447 Free PMC article. Review.
References
-
- Aghajanian GK, Marek GJ. Serotonin, via 5-HT2a receptors, increases EPSCs in layer V pyramidal cells of prefrontal cortex by an asynchronous mode of glutamate release. Brain Res. 1999;825:161–171. - PubMed
-
- Amargós-Bosch M, Bortolozzi A, Puig MV, Serrats J, Adell A, Celada P, Toth M, Mengod G, Artigas F. Co-expression and in vivo interaction of serotonin1A and serotonin2A receptors in pyramidal neurons of prefrontal cortex. Cereb Cortex. 2004;14:281–299. - PubMed
-
- Aznar S, Qian Z, Shah R, Rahbek B, Knudsen GM. The 5-HT1A serotonin receptor is located on calbindin- and parvalbumin-containing neurons in the rat brain. Brain Res. 2003;959:58–67. - PubMed
-
- Bartos M, Vida I, Jonas P. Synaptic mechanisms of synchronized gamma oscillations in inhibitory interneuron networks. Nat Rev Neurosci. 2007;8:45–56. - PubMed
-
- Başar E, Güntekin B. A review of brain oscillations in cognitive disorders and the role of neurotransmitters. Brain Res. 2008;1235:172–193. - PubMed
Publication types
MeSH terms
Substances
LinkOut - more resources
Full Text Sources
Miscellaneous