

Neural bases for addictive properties of benzodiazepines
- PMID: 20148031
- PMCID: PMC2871668
- DOI: 10.1038/nature08758
Neural bases for addictive properties of benzodiazepines
Abstract
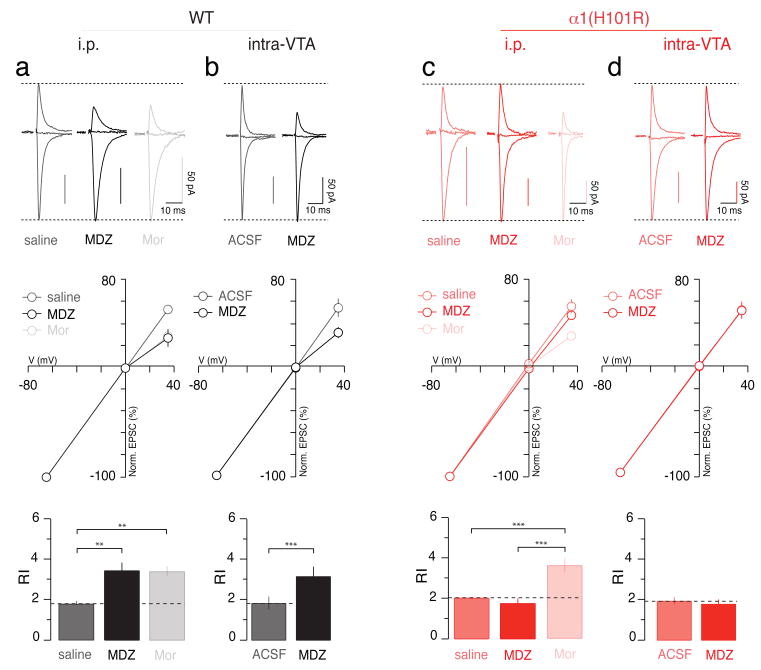
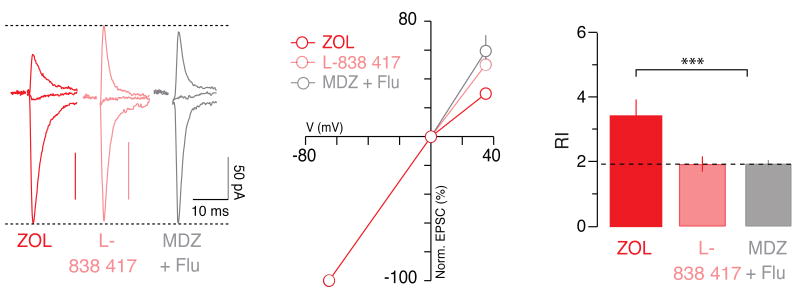
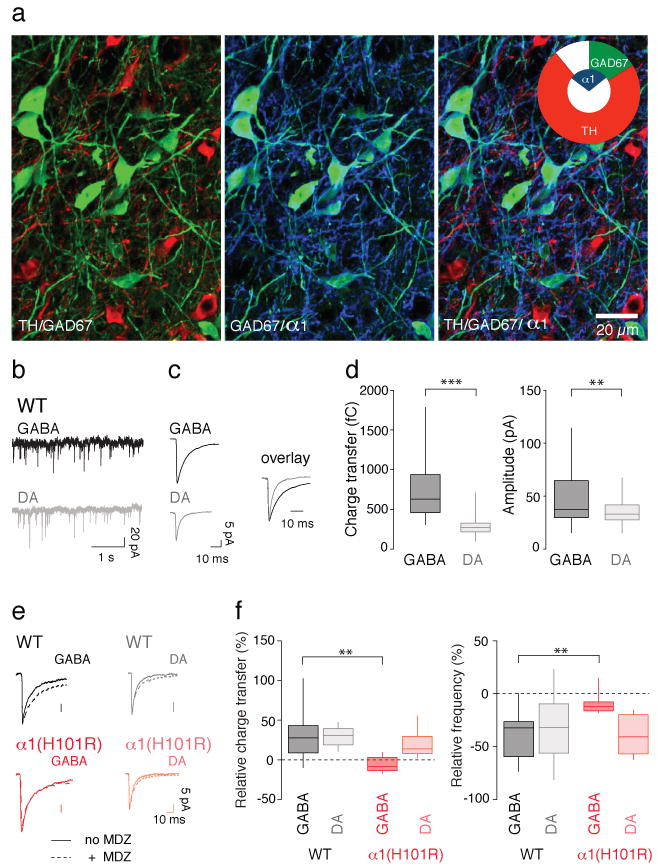
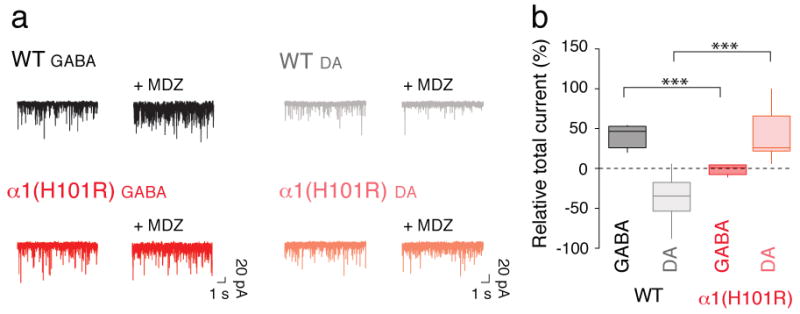
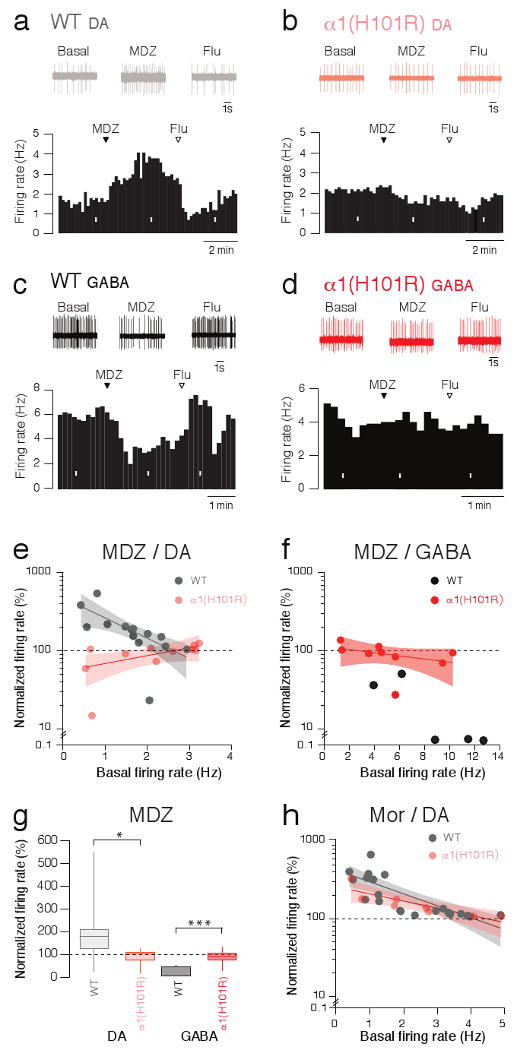
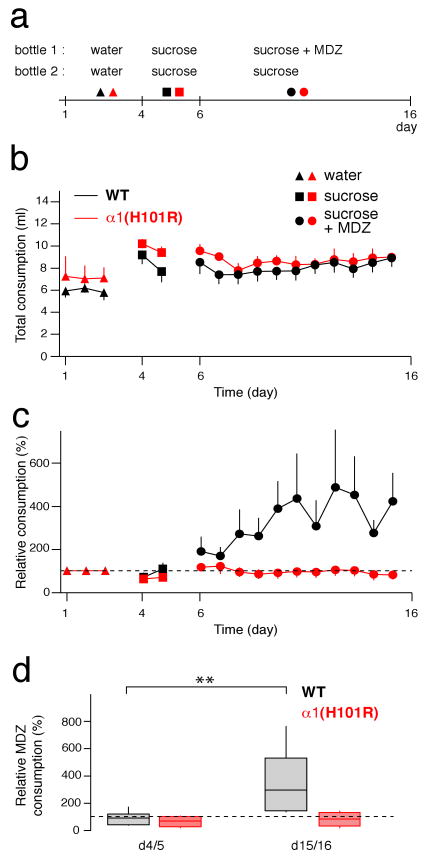
Benzodiazepines are widely used in clinics and for recreational purposes, but will lead to addiction in vulnerable individuals. Addictive drugs increase the levels of dopamine and also trigger long-lasting synaptic adaptations in the mesolimbic reward system that ultimately may induce the pathological behaviour. The neural basis for the addictive nature of benzodiazepines, however, remains elusive. Here we show that benzodiazepines increase firing of dopamine neurons of the ventral tegmental area through the positive modulation of GABA(A) (gamma-aminobutyric acid type A) receptors in nearby interneurons. Such disinhibition, which relies on alpha1-containing GABA(A) receptors expressed in these cells, triggers drug-evoked synaptic plasticity in excitatory afferents onto dopamine neurons and underlies drug reinforcement. Taken together, our data provide evidence that benzodiazepines share defining pharmacological features of addictive drugs through cell-type-specific expression of alpha1-containing GABA(A) receptors in the ventral tegmental area. The data also indicate that subunit-selective benzodiazepines sparing alpha1 may be devoid of addiction liability.
Figures
Comment in
-
Neuroscience: Lack of inhibition leads to abuse.Nature. 2010 Feb 11;463(7282):743-4. doi: 10.1038/463743a. Nature. 2010. PMID: 20148025 Free PMC article.
Similar articles
-
Neuroscience: Lack of inhibition leads to abuse.Nature. 2010 Feb 11;463(7282):743-4. doi: 10.1038/463743a. Nature. 2010. PMID: 20148025 Free PMC article.
-
Long-lasting modulation of glutamatergic transmission in VTA dopamine neurons after a single dose of benzodiazepine agonists.Neuropsychopharmacology. 2009 Jan;34(2):290-8. doi: 10.1038/npp.2008.89. Epub 2008 Jun 18. Neuropsychopharmacology. 2009. PMID: 18563060
-
GABA site agonist gaboxadol induces addiction-predicting persistent changes in ventral tegmental area dopamine neurons but is not rewarding in mice or baboons.J Neurosci. 2012 Apr 11;32(15):5310-20. doi: 10.1523/JNEUROSCI.4697-11.2012. J Neurosci. 2012. PMID: 22496576 Free PMC article.
-
Hooked on benzodiazepines: GABAA receptor subtypes and addiction.Trends Neurosci. 2011 Apr;34(4):188-97. doi: 10.1016/j.tins.2011.01.004. Epub 2011 Feb 25. Trends Neurosci. 2011. PMID: 21353710 Free PMC article. Review.
-
Dopamine neurons in the ventral tegmental area: drug-induced synaptic plasticity and its role in relapse to drug-seeking behavior.Curr Drug Abuse Rev. 2011 Dec;4(4):270-85. doi: 10.2174/1874473711104040270. Curr Drug Abuse Rev. 2011. PMID: 21834753 Review.
Cited by
-
Conditioned Aversion and Neuroplasticity Induced by a Superagonist of Extrasynaptic GABAA Receptors: Correlation With Activation of the Oval BNST Neurons and CRF Mechanisms.Front Mol Neurosci. 2019 May 24;12:130. doi: 10.3389/fnmol.2019.00130. eCollection 2019. Front Mol Neurosci. 2019. PMID: 31178693 Free PMC article.
-
Addiction-induced plasticity in underlying neural circuits.Neurol Sci. 2022 Mar;43(3):1605-1615. doi: 10.1007/s10072-021-05778-y. Epub 2022 Jan 22. Neurol Sci. 2022. PMID: 35064341 Review.
-
Beyond classical benzodiazepines: novel therapeutic potential of GABAA receptor subtypes.Nat Rev Drug Discov. 2011 Jul 29;10(9):685-97. doi: 10.1038/nrd3502. Nat Rev Drug Discov. 2011. PMID: 21799515 Free PMC article. Review.
-
Duration of treatment and activation of α1-containing GABAA receptors variably affect the level of anxiety and seizure susceptibility after diazepam withdrawal in rats.Brain Res Bull. 2014 May;104:1-6. doi: 10.1016/j.brainresbull.2014.03.002. Epub 2014 Mar 30. Brain Res Bull. 2014. PMID: 24695241 Free PMC article.
-
An Emerging Circuit Pharmacology of GABAA Receptors.Trends Pharmacol Sci. 2018 Aug;39(8):710-732. doi: 10.1016/j.tips.2018.04.003. Epub 2018 Jun 11. Trends Pharmacol Sci. 2018. PMID: 29903580 Free PMC article. Review.
References
-
- O'brien CP. Benzodiazepine use, abuse, and dependence. J Clin Psychiatry. 2005;66(2):28–33. - PubMed
-
- Saal D, Dong Y, Bonci A, Malenka RC. Drugs of abuse and stress trigger a common synaptic adaptation in dopamine neurons. Neuron. 2003;37:577–582. - PubMed
-
- Bellone C, Lüscher C. Cocaine triggered AMPA receptor redistribution is reversed in vivo by mGluR-dependent long-term depression. Nat Neurosci. 2006;9:636–641. - PubMed
Publication types
MeSH terms
Substances
Grants and funding
LinkOut - more resources
Full Text Sources
Other Literature Sources
