Immunosuppressant neurotoxicity in rat brain models: oxidative stress and cellular metabolism
- PMID: 20148532
- PMCID: PMC2841482
- DOI: 10.1021/tx900351q
Immunosuppressant neurotoxicity in rat brain models: oxidative stress and cellular metabolism
Abstract
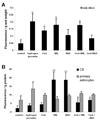
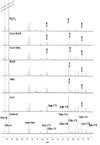
Coadministration of the calcineurin inhibitor cyclosporine (CsA) and the mTOR inhibitors sirolimus (SRL) or everolimus (RAD) increases the efficacy of immunosuppression after organ transplantation. Neurotoxicity of CsA is a major clinical problem. Our goal was to assess the effects of CsA, SRL, and RAD on brain cell metabolism. The studies included the comparison of immunosuppressant-mediated effects on glucose metabolism, energy production, and reactive oxygen species (ROS) formation in perfused rat brain slices, primary rat astrocytes, and C6 glioma cells. In brain slices and astrocytes, CsA inhibited Krebs cycle metabolism, while activating anaerobic glycolysis, most likely to compensate for the inhibition of mitochondrial energy production. SRL and RAD inhibited cytosolic glycolysis but did not cause changes in mitochondrial energy production. CsA + SRL inhibited Krebs cycle and glycolysis, thus reducing the ability of the cell to compensate for the negative effects of CsA on mitochondrial nucleoside triphosphate synthesis. In contrast to SRL at the concentrations tested, RAD reduced the CsA-induced ROS formation and antagonized CsA-induced effects on glucose and energy metabolism. Surprisingly, in C6 cells, SRL and RAD exposure resulted in high ROS concentrations without significant impairment of cell metabolism. Our results suggested that SRL enhances CsA-induced ROS formation and negative metabolic effects in brain cells, while RAD seems to antagonize the CsA effects. However, the three models showed different metabolic responses when challenged with the study drugs. In contrast to SRL, RAD enhances ROS formation in C6 glioma cells but has only minor effects on normal rat brain tissue.
Figures


Similar articles
-
Everolimus and sirolimus in combination with cyclosporine have different effects on renal metabolism in the rat.PLoS One. 2012;7(10):e48063. doi: 10.1371/journal.pone.0048063. Epub 2012 Oct 31. PLoS One. 2012. PMID: 23118926 Free PMC article.
-
Alterations in glucose metabolism by cyclosporine in rat brain slices link to oxidative stress: interactions with mTOR inhibitors.Br J Pharmacol. 2004 Oct;143(3):388-96. doi: 10.1038/sj.bjp.0705939. Epub 2004 Aug 31. Br J Pharmacol. 2004. PMID: 15339861 Free PMC article.
-
Age and sex differences in the effects of the immunosuppressants cyclosporine, sirolimus and everolimus on rat brain metabolism.Neurotoxicology. 2011 Jan;32(1):50-7. doi: 10.1016/j.neuro.2010.10.006. Epub 2010 Nov 12. Neurotoxicology. 2011. PMID: 21075140
-
Preclinical results of sirolimus treatment in transplant models.Transplant Proc. 2003 May;35(3 Suppl):219S-226S. doi: 10.1016/s0041-1345(03)00222-7. Transplant Proc. 2003. PMID: 12742499 Review.
-
Early clinical experience with a novel rapamycin derivative.Ther Drug Monit. 2002 Feb;24(1):53-8. doi: 10.1097/00007691-200202000-00010. Ther Drug Monit. 2002. PMID: 11805723 Review.
Cited by
-
Calcineurin signaling as a target for the treatment of alcohol abuse and neuroinflammatory disorders.Prog Mol Biol Transl Sci. 2019;167:125-142. doi: 10.1016/bs.pmbts.2019.06.008. Epub 2019 Aug 12. Prog Mol Biol Transl Sci. 2019. PMID: 31601401 Free PMC article. Review.
-
Cardiovascular effects of immunosuppression agents.Front Cardiovasc Med. 2022 Sep 21;9:981838. doi: 10.3389/fcvm.2022.981838. eCollection 2022. Front Cardiovasc Med. 2022. PMID: 36211586 Free PMC article. Review.
-
Everolimus and sirolimus in combination with cyclosporine have different effects on renal metabolism in the rat.PLoS One. 2012;7(10):e48063. doi: 10.1371/journal.pone.0048063. Epub 2012 Oct 31. PLoS One. 2012. PMID: 23118926 Free PMC article.
-
The Emerging Roles of the Calcineurin-Nuclear Factor of Activated T-Lymphocytes Pathway in Nervous System Functions and Diseases.J Aging Res. 2016;2016:5081021. doi: 10.1155/2016/5081021. Epub 2016 Aug 15. J Aging Res. 2016. PMID: 27597899 Free PMC article. Review.
-
Low-salt diet and cyclosporine nephrotoxicity: changes in kidney cell metabolism.J Proteome Res. 2012 Nov 2;11(11):5135-44. doi: 10.1021/pr300260e. Epub 2012 Oct 11. J Proteome Res. 2012. PMID: 23057591 Free PMC article.
References
-
- Kahan BD. Immunosuppressive therapy. Curr Opin Immunol. 1992;4:553–560. - PubMed
-
- Borel JF, Baumann G, Chapman I, Donatsch P, Fahr A, Mueller EA, Vigouret JM. In vivo pharmacological effects of ciclosporin and some analogues. Adv Pharmacol. 1996;35:115–246. - PubMed
-
- Aramburu J, Rao A, Klee CB. Calcineurin: from structure to function. Curr Top Cell Regul. 2000;36:237–295. - PubMed
-
- Serkova NJ, Christians U, Benet LZ. Biochemical mechanisms of cyclosporine neurotoxicity. Mol Interv. 2004;4:97–107. - PubMed
-
- Atkinson K, Biggs J, Darveniza P, Boland J, Concannon A, Dodds A. Cyclosporine-associated central-nervous-system toxicity after allogeneic bone-marrow transplantation. N Engl J Med. 1984;310:527. - PubMed
Publication types
MeSH terms
Substances
Grants and funding
LinkOut - more resources
Full Text Sources
Miscellaneous

