. 2010 Mar 1;82(5):1905-10.
doi: 10.1021/ac9027356.

Label-free biomarker sensing in undiluted serum with suspended microchannel resonators

Affiliations

Label-free biomarker sensing in undiluted serum with suspended microchannel resonators

Marcio G von Muhlen et al. Anal Chem. .

Abstract

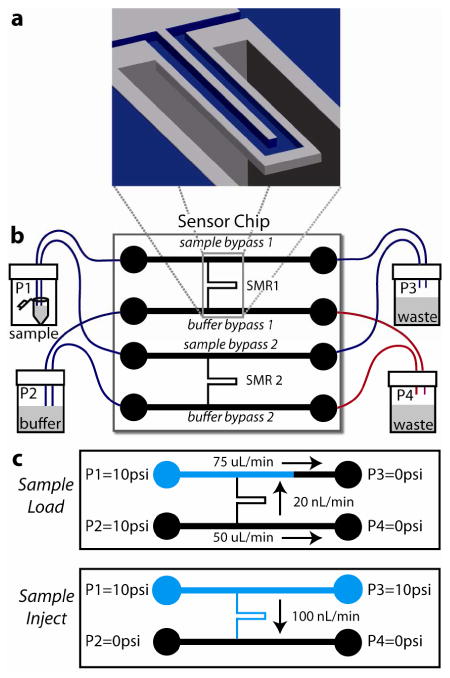
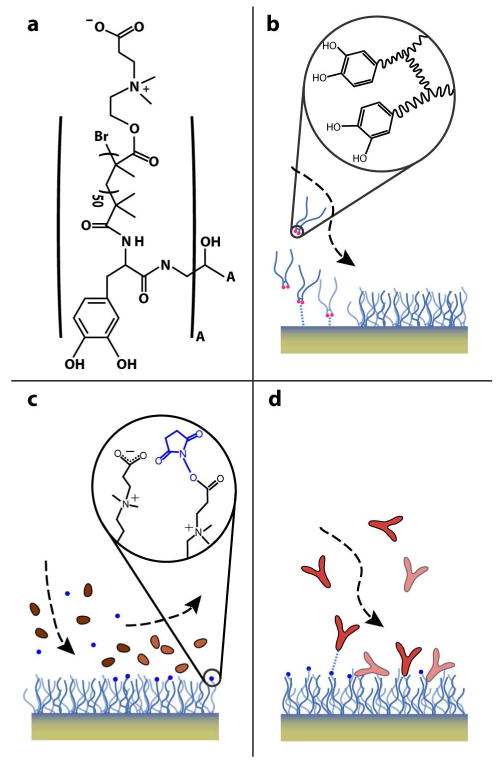
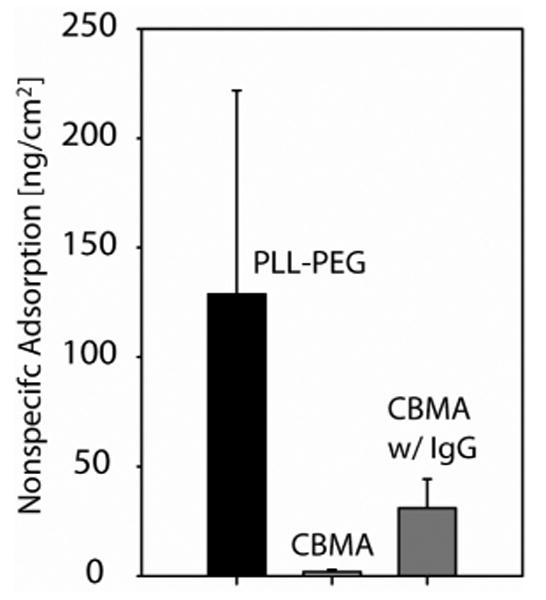
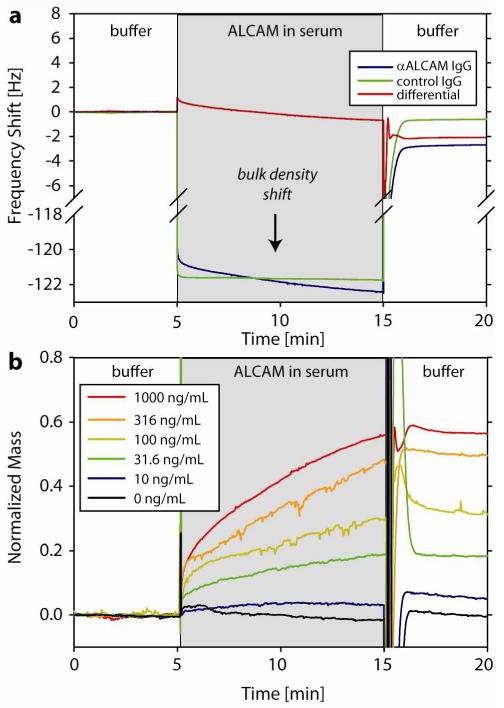
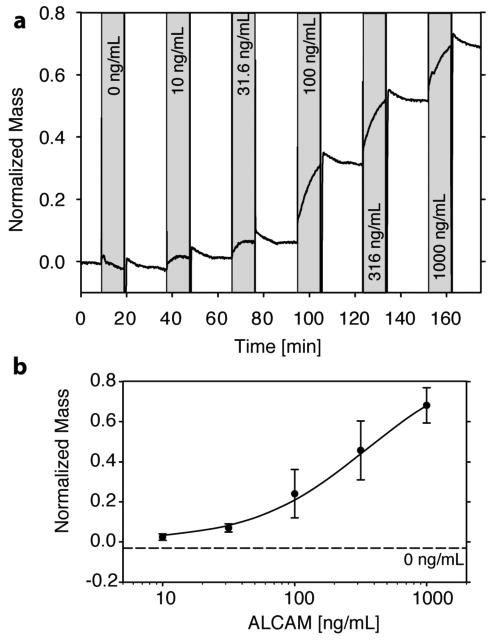
Improved methods are needed for routine, inexpensive monitoring of biomarkers that could facilitate earlier detection and characterization of cancer. Suspended microchannel resonators (SMRs) are highly sensitive, batch-fabricated microcantilevers with embedded microchannels that can directly quantify adsorbed mass via changes in resonant frequency. As in other label-free detection methods, biomolecular measurements in complex media such as serum are challenging due to high background signals from nonspecific binding. In this report, we demonstrate that carboxybetaine-derived polymers developed to adsorb directly onto SMR SiO(2) surfaces act as ultralow fouling and functionalizable surface coatings. Coupled with a reference microcantilever, this approach enables detection of activated leukocyte cell adhesion molecule (ALCAM), a model cancer biomarker, in undiluted serum with a limit of detection of 10 ng/mL.


Figures

Figure 1
Figure 1
Suspended microchannel resonator (SMR) system schematic. (a) Cut-away view of SMR microcantilever. The U-shaped sensor channel has a 3 × 8 μm cross section and is embedded in a resonating silicon beam extending 200 μm into a vacuum packaged cavity. (b) Sensor chip with 2 SMRs addressable by bypass channels connected by Teflon tubing to pressure-controlled vials off-chip; one SMR is used as a control (reference) sensor. Blue tubing: ID 225 μm, red tubing: ID 150 μm. (c) Fluid delivery schemes: Sample Load fills sample bypass channels with sample (blue) while the microcantilevers and buffer bypasses are flushed with running buffer (black), Sample Inject delivers a sharp concentration sample to the microcantilevers. Figures not to scale.
Figure 2
Figure 2
DOPA2-pCBMA2 adsorption and antibody functionalization schematic. (a) The structure of the DOPA2-pCBMA2 polymer is shown; “A” represents the structure inside the large parentheses, two of which are connected by a R-COH-R bridge. The polymer adsorbs directly onto the thin SiO2 layer of the Si microcantilever surfaces (b), immobilizing a monolayer of 275-360 ng/cm2. (c) Terminal carboxylic acids are transformed to reactive NHS esters by injection of a mixture of NHS and EDC. (d) NHS-esters react with primary amines on IgG antibodies to covalently bind them to the surface.
Figure 3
Figure 3
Total nonspecific adsorption after serum injection over PLL-PEG and DOPA2-pCBMA2 surface coatings with and without antibody (IgG) functionalization; n=3, error bar is 1 s.d. Serum incubation time was 5 minutes, followed by surface washing with PBS for 10 min. The adsorbed layer density was assumed to be 1.35 mg/mL.
Figure 4
Figure 4
Sensor response to ALCAM-spiked serum on DOPA2-pCBMA2 surfaces functionalized with anti-ALCAM IgG (sensing) and whole goat IgG (control). (a) The mass of specifically bound ALCAM can be quantified by the change in the differential frequency before and after injection of 1,000 ng/mL ALCAM. Serum is denser than the PBS running buffer by 1.25%, which results in a -121 Hz bulk density shift during sample injection for both microcantilevers. (b) Dose-response traces for ALCAM injections on de novo functionalized SMR surfaces. The transition from sample to buffer at t=15 min momentarily exhibits large fluctuations due to non-synchronous rinsing of sensor and control SMRs.
Figure 5
Figure 5
Serial injections of increasing ALCAM concentrations allow construction of a dose-response curve with the same SMR surface. (a) Samples were injected for 10 min each (shaded bars) with 18 min PBS rinse between samples. (b) Cumulative binding signals (n=3), error bars ±1 s.d. The mean response to pure serum (negative control) is plotted as a dashed line (s.d. = 0.02). The response for each concentration is calculated relative to the initial baseline after the 18 min PBS rinse. The solid line is a variance weighed fit to the Langmuir equation.

Similar articles

Cited by

References

    1. Hanash SM, Pitteri SJ, Faca VM. Nature. 2008;452:571–579. - PubMed
    1. Sano T, Smith C, Cantor C. Science. 1992;258:120–122. - PubMed
    1. Schweitzer B, Roberts S, Grimwade B, Shao W, Wang M, Fu Q, Shu Q, Laroche I, Zhou Z, Tchernev VT, Christiansen J, Velleca M, Kingsmore SF. Nat Biotechnol. 2002;20:359–365. - PMC - PubMed
    1. Fredriksson S, Gullberg M, Jarvius J, Olsson C, Pietras K, Gustafsdottir SM, Ostman A, Landegren U. Nat Biotechnol. 2002;20:473–477. - PubMed
    1. Zhu H, Snyder M. Curr Opin Chem Biol. 2003;7:55–63. - PubMed

Publication types