. 2010 Apr;76(1):173-89.
doi: 10.1111/j.1365-2958.2010.07088.x. Epub 2010 Feb 10.

Caulobacter PopZ forms a polar subdomain dictating sequential changes in pole composition and function

Affiliations

Caulobacter PopZ forms a polar subdomain dictating sequential changes in pole composition and function

Grant R Bowman et al. Mol Microbiol. 2010 Apr.

Abstract

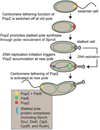
The bacterium Caulobacter crescentus has morphologically and functionally distinct cell poles that undergo sequential changes during the cell cycle. We show that the PopZ oligomeric network forms polar ribosome exclusion zones that change function during cell cycle progression. The parS/ParB chromosomal centromere is tethered to PopZ at one pole prior to the initiation of DNA replication. During polar maturation, the PopZ-centromere tether is broken, and the PopZ zone at that pole then switches function to act as a recruitment factor for the ordered addition of multiple proteins that promote the transformation of the flagellated pole into a stalked pole. Stalked pole assembly, in turn, triggers the initiation of chromosome replication, which signals the formation of a new PopZ zone at the opposite cell pole, where it functions to anchor the newly duplicated centromere that has traversed the long axis of the cell. We propose that pole-specific control of PopZ function co-ordinates polar development and cell cycle progression by enabling independent assembly and tethering activities at the two cell poles.


Figures
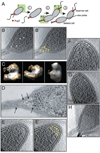
Fig. 1
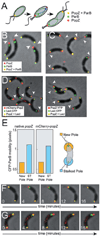
Fig. 1. PopZ establishes a ribosome exclusion zone at the cell poles
A. A schematic of cell division in C. crescentus. PopZ localization is represented in red, and the poles shown in other panels are denoted by a green box. B. An individual section from a three-dimensional reconstruction of a Cryo-EM tomogram of a wild-type cell preserved in vitreous ice, showing a stalked pole, with the ribosome exclusion zone outlined in yellow in B′. Examples of individual ribosomes are marked by arrowheads. C. The high contrast globular particles observed in Cryo-EM tomograms are ribosomes. The averaged structure of the dense globular particles found in C. crescentus cytoplasm (white) is overlayed on the structure the E. coli ribosome (yellow) revealing similarity in size and shape. Three different angles of rotation are shown. D. Immuno-gold labelling of PopZ (arrows) at the stalked pole of a wild-type cell. E. A Cryo-EM section of a flagellated pole, with the ribosome exclusion zone outlined in yellow in E′. The flagellar motor was clearly visualized in a different section of this data set (not shown). F. A new pole in a swarmer cell (Cryo-EM). Dense, ribosome studded cytoplasm extends to the membrane (arrowheads), an observation repeated in over 30 cells. G. A cell pole in a ΔpopZ cell (Cryo-EM), strain GB255, with ribosome studded cytoplasm extending to the membrane. H. A stalked pole of a PopZ overproducing cell (Cryo-EM), strain GB123 (top panel), exhibiting an enlarged ribosome exclusion zone. PopZ overproduction was stimulated by growth in 0.3% xylose for 4 h prior to freezing.
Fig. 2
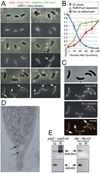
Fig. 2. The centromere tethering function of PopZ is lost at the stalked pole
A. Schematic of ParB and PopZ localization during chromosome replication and centromere translocation. The chromosome is represented as a green oval, and the direction of movement during translocation is indicated by a blue arrow. B. Cells of strain GB301, producing PopZ-YFP (red) and CFP-ParB (green). Fluorescence channels are overlayed on the phase-contrast image. Visible stalks are indicated by arrowheads. Fluorescence signals were considered ‘partially overlapping’ when 0–50% of the area of the smaller diameter signal was contained within the area of the larger diameter signal. C. Cells of strain GB529, producing mCherry-PopZ (in red) and CFP-ParB (in green), processed as in (B). D. In FROS (Straight et al., 1996; Viollier et al., 2004), exogenously expressed LacI-CFP binds to tandem arrays of lac operator sites inserted at a specific location on the chromosome, here a centromere proximal sequence. This labelling was performed in the context of mCherry-PopZ expression (left panel, strain GB593) and PopZ-YFP expression (right panel, strain GB594). Images were processed as in B, and visible stalks are marked by arrowheads. E. Quantification of the motion of CFP-ParB foci at flagellated and stalked poles in time lapse movies of strain MT190 and GB529. Position was determined by calculating the weighted centroid of a fluorescent focus, and distance was measured in pixels, with a measured pixel width of approximately 80 nm. The plot shows average displacement after a four-minute interval. In three separate experiments, ~60 cells of each strain were analysed over four consecutive time intervals, yielding a total of over 700 data points. The standard error on the determination of the mean value was negligibly small. F and G. Individual frames from time lapse movies of strain GB529 (F) and GB301 (G). Time (in minutes) is indicated. The CFP-ParB focus (green) moves back-and-forth in the vicinity of the stalked pole (top), but remains stationary at the flagellar pole (bottom). All experiments were performed in M2G medium.
Fig. 3
Fig. 3. Centromere detachment occurs before stalked pole development is complete
A. Swarmer cells were isolated from strain GB433, expressing CFP-ParB (green), PopZ-YFP (red) and DivJ-mCherry (grey image, lower panels), and grown in M2G medium. At the indicated time (in minutes), an aliquot of cells was removed any analysed by fluorescence microscopy. Representative examples are shown. CFP-ParB and PopZ-YFP were considered separated when less than 50% of the area of the smaller diameter signal was contained within the area of the larger diameter signal (arrowheads). Polar DivJ-mCherry foci are marked by arrows. B. Quantification of the localization patterns observed in (A). Cells with no DivJ-mCherry focus and colocalized PopZ-YFP/CFP-ParB were scored as swarmer cells. Over 200 cells per time point from each of three separate trials were counted. Error bars represent the standard deviation between trials. C. Colocalization of PopZ-YFP (green) and DivJ-mCherry (red) at the stalked pole (arrows) in strain GB433. For all experiments, cells were grown in M2G medium. D. Immuno-gold labelling of DivJ at a stalked pole in a wild-type cell. The gold particles (arrows) are limited to area of low ribosome density at the base of the pole. E. A co-immunoprecipitation assay shows that DivJ and PopZ are in close molecular proximity. Strains GB135 (popZ-m2) and LS4379 (hfq-m2) were treated with DSP cross-linker prior to lysis in detergent buffer. Samples of the lysate (Ly) and affinity purified PopZ-M2 protein complexes (El) were probed with anti-DivJ and anti-HU antibodies by immunoblotting.
Fig. 4
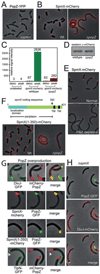
Fig. 4. PopZ recruits SpmX to the stalked pole through a periplasmic intermediary
A. Localization of PopZ-YFP in ΔspmX cells (strain GB507). B. Localization of SpmX-mCherry in wild-type (strain GB378) and ΔpopZ cells (strain GB387). C. Quantification of the data in (B), as described in Experimental procedures. Peak refers to the intensity of the localized signal; Deloc refers to the median intensity of the delocalized signal across the cell body. D. A Western blot showing the cellular levels of SpmX-mCherry protein in native popZ and ΔpopZ backgrounds. E. Localization of SpmX-mCherry in FtsZ depletion strain GB574. Cells were grown in PYE medium supplemented with 0.03% xylose, then washed and grown for 3.5 hours in the same medium (upper panel) or PYE without xylose (lower panel). F. A schematic of the spmX coding sequence (upper panel), with transmembrane domains (TM) indicated in black. The N-terminal localization domain (blue) is predicted to be exported to the periplasm. Localization (lower panel) of SpmX(1–350)-mCherry in wild-type (strain GB440) and ΔpopZ cells (strain GB447). SpmX(1–350)-mCherry expression was induced by growth in 50 µM vanillate for two hours prior to analysis. G. Effects of PopZ overproduction on the localization of polar proteins. Top panel: DivJ-GFP localization during mCherry-PopZ overproduction (strain GB449). Middle panels: SpmX-mCherry and SpmX(1–350)-mCherry localization during PopZ-GFP overproduction (Strains GB430 and GB453). Lower panel: TipN-GFP localization during mCherry-PopZ overproduction (strain GB450). To achieve PopZ overproduction, cells were stimulated by growth in 0.3% xylose for 5 h prior to analysis. H. DivJ-mCherry remains delocalized in a ΔspmX mutant in the context of PopZ-GFP overproduction (strain GB514). For PopZ-GFP overproduction, cells were stimulated as in (F). For all experiments, strains were grown in PYE medium and coloured fluorescence images are placed on a phase-contrast background.
Fig. 5
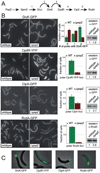
Fig. 5. PopZ mediates multi-protein complex assembly at the developing stalked pole
A. An outline of the ClpXP protease localization and assembly pathway during stalked pole development. Curved arrows indicate control through phosphosignalling and straight arrows indicate physical protein interactions that are required for polar localization. The dotted line from PopZ to SpmX is inferred. References: 1: Radhakrishnan et al. (2008); 2: Jacobs et al. (2001); 3: Iniesta and Shapiro (2008); 4: Iniesta et al. (2006); 5: Mcgrath et al. (2006). B. Localization of DivK-GFP, CpdR-YFP, ClpX-GFP and RcdA-GFP in wild-type and ΔpopZ cells grown in M2G medium. For each fluorescent protein, representative fluorescence image panels are placed beside quantified data from at least two independent experiments, each involving more than 200 cells, with error bars representing the standard deviation between trials. At the far right of each panel is a Western blot showing the cellular levels of the fluorescently tagged protein under these conditions. Below each blot, the numbers refer to the quantification and normalization of band intensities, with wild-type level set to 1. Reading from top left, the strains used were GB229, GB459, LS4250, GB460, LS4183, GB457, LS4191 and GB458. C. Effects of PopZ overproduction on DivK-GFP, CpdR-YFP, ClpX-GFP and RcdA-GFP localization. Strains GB281, GB235, GB233 and GB265 were stimulated by growth in PYE medium supplemented with 0.3% xylose for eight hours prior to analysis.
Fig. 6
Fig. 6. DNA replication is not required for centromere detachment, but is required for the accumulation of PopZ at the new cell pole
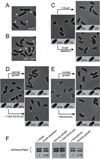
A and B. Defects in stalked pole development do not prevent the detachment of CFP-ParB foci from polar mCherry-PopZ. CFP-ParB (green) and mCherry-PopZ (red) localization is shown in a ΔcpdR background, strain GB559 (A), and in a pleC∷Tn5 background, strain GB566 (B). Arrowheads mark poles where CFP-ParB foci are not colocalized with mCherry-PopZ. C. DnaA depletion does not prevent the detachment of CFP-ParB foci from polar mCherry-PopZ. Swarmer cells (left panel) isolated from strain GB569 were grown in M2X or M2G media supplemented with 50 µM vanillate for normal growth (top panel) or growth under DnaA depletion (lower panel) respectively. Images were collected after 90 min of growth in liquid media. The diagrams and percentages below each image indicate the percentage of cells containing single foci of mCherry-PopZ and CFP-ParB that overlapped by > 50% (left) or by < 50% (right). D. Constitutively active CtrA does not prevent the detachment of CFP-ParB from polar mCherry-PopZ. Swarmer cells were isolated from strain GB532 were grown in M2G or M2X media supplemented with 50 µM vanillate for normal growth (top panel) or growth under CtrA D51EΔ3Ω production (lower panel) respectively. Image collection and quantification was as in (C). E. The detachment of CFP-ParB from PopZ-YFP is maintained after DNA replication is blocked with novobiocin treatment. Swarmer cells isolated from strain GB529 were grown in M2G supplemented with 50 µM vanillate in the absence or presence of 100 µg ml−1 novobiocin, and images were collected and quantified as in (C). F. Western blots showing the level of mCherry-PopZ in whole cell lysates taken from the experiments in (C) to (E). mCherry-PopZ is partially degraded and runs as a doublet. For each experiment, combined band intensity was normalized with respect to the control.
Fig. 7
Fig. 7
A description of PopZ activity during the cell cycle. Details are described in the text.

Similar articles

Cited by

References

    1. Aaron M, Charbon G, Lam H, Schwarz H, Vollmer W, Jacobs-Wagner C. The tubulin homologue FtsZ contributes to cell elongation by guiding cell wall precursor synthesis in Caulobacter crescentus. Mol Microbiol. 2007;64:938–952. - PubMed
    1. Baker TA, Funnell BE, Kornberg A. Helicase action of dnaB protein during replication from the Escherichia coli chromosomal origin in vitro. J Biol Chem. 1987;262:6877–6885. - PubMed
    1. Bowers LM, Shapland EB, Ryan KR. Who’s in charge here? Regulating cell cycle regulators. Curr Opin Microbiol. 2008;11:547–552. - PubMed
    1. Bowman GR, Comolli LR, Zhu J, Eckart M, Koenig M, Downing KH, et al. A polymeric protein anchors the chromosomal origin/ParB complex at a bacterial cell pole. Cell. 2008;134:945–955. - PMC - PubMed
    1. Collier J, Shapiro L. Spatial complexity and control of a bacterial cell cycle. Curr Opin Biotechnol. 2007;18:333–340. - PMC - PubMed

Publication types