. 2010 May;31(13):3613-21.
doi: 10.1016/j.biomaterials.2010.01.079. Epub 2010 Feb 9.

Biohybrid thin films for measuring contractility in engineered cardiovascular muscle

Affiliations

Biohybrid thin films for measuring contractility in engineered cardiovascular muscle

Patrick W Alford et al. Biomaterials. 2010 May.

Abstract

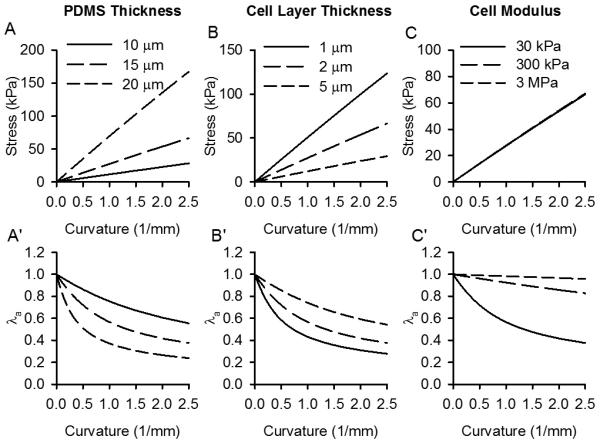
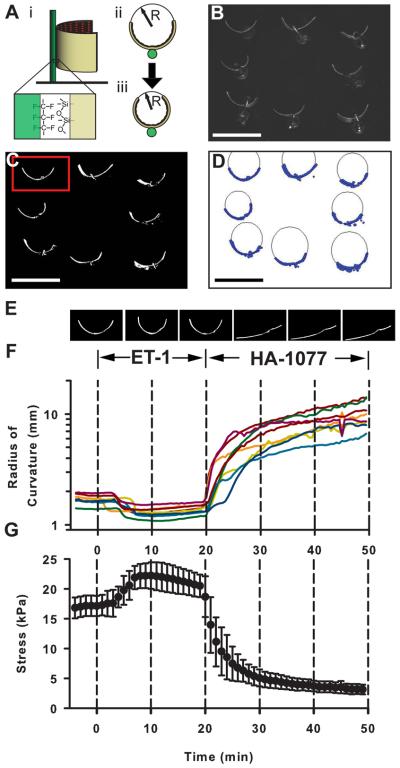
In vitro cardiovascular disease models need to recapitulate tissue-scale function in order to provide in vivo relevance. We have developed a new method for measuring the contractility of engineered cardiovascular smooth and striated muscle in vitro during electrical and pharmacological stimulation. We present a growth theory-based finite elasticity analysis for calculating the contractile stresses of a 2D anisotropic muscle tissue cultured on a flexible synthetic polymer thin film. Cardiac muscle engineered with neonatal rat ventricular myocytes and paced at 0.5 Hz generated stresses of 9.2 +/- 3.5 kPa at peak systole, similar to measurements of the contractility of papillary muscle from adult rats. Vascular tissue engineered with human umbilical arterial smooth muscle cells maintained a basal contractile tone of 13.1 +/- 2.1 kPa and generated another 5.1 +/- 0.8 kPa when stimulated with endothelin-1. These data suggest that this method may be useful in assessing the efficacy and safety of pharmacological agents on cardiovascular tissue.


Figures

Figure 1
Figure 1
(A) Image of the experimental setup used to measure cMTF contractions. The cMTF is mounted sideways in a PDMS clamp that is fixed to the bottom of a 35 mm diameter Petri dish. A signal generator is attached to the parallel platinum electrodes to provide controlled pacing signals. A millimeter scale ruler is placed below the Petri dish as a calibration reference. The entire setup is placed on a stereomicroscope with darkfield illumination. (B-D) Representative steps of the image processing procedure used to determine the MTF radius of curvature during contraction. (B) The raw grayscale image is digital recorded. (C) The image is thresholded to convert it to a binary image. (D) The binary image is skeletonized to find the midline. (E-F) Images of experimental setup used to measure vMTF contractions. (E) vMTFs are imaged in a custom designed 35 mm dish. Eight PTFE posts are arranged so they stand vertically within the dish. Dish is heated with a Peltier heater during the experiment. (F) One MTF is mounted on each post.
Figure 2
Figure 2
Schematic representation of analysis method. (A) The beam is assumed to be straight and stress free in the undeformed configuration. In the deformed configuration, the beam is assumed to have a uniform curvature. (B) The analysis assumes that if the PDMS layer and cell layer are decoupled the cell layer will undergo a stress free deformation described by Fa. The true, measured, deformation is given by F. The elastic deformation is given by Fe and is defined as Fe=F.Fa
Figure 3
Figure 3
Muscular thin film method and microstructure. (A) Schematic representation of MTF assay illustrating MTF fabrication, release and the change in radius of curvature during muscle contraction. (B) Immunofluorescent image of 20μm lines of laminin spaced by 20μm gaps. (scale: 50μm) (C) Topological scan of 10×10 μm stamped laminin, using atomic force microscope. (D) Line scan following line in red in (C) showing the height change of substrate following LAM stamping. (E) Anisotropically patterned vascular smooth muscle tissue; red: 10×10μm patterned LAM, green: Factin, blue: nuclei. (scale: 50μm) (F) Anisotropically patterned cardiomyocytes; red: α-actinin, green: F-actin, blue: nuclei. (scale: 30μm)
Figure 4
Figure 4
Analysis of microscale cytoskeletal structure and macroscale contractility of anisotropic cardiac MTFs. (A) Confocal image of an engineered anisotropic cardiac monolayer stained for F-actin (green) and sarcomeric α-actinin (red). (B) Close-up of anisotropic monolayer showing uniaxial orientation of sarcomere Z-disks (stained for sarcomeric α-actinin). Example anisotropic cardiac MTF in (C) diastole and (D) peak systole during 0.5 Hz paced contraction. (E) Stress versus time for an anisotropic cardiac MTF during 0.5 Hz paced contractions. (F) The anisotropic cardiac MTF undergoes isometric contraction shortening < 1% at peak systole, however knowing the stress generated by the muscle and the elastic modulus of the cells (E ~30 kPa) the unconstrained shortening can be estimated as ~25% at peak systole (dashed line, see Online Methods for details). (G) Velocity of the contractile wave can be calculated from the spontaneous contraction of an anisotropic cardiac MTF from diastole at t = −0.16 s (red) and observing deformation at subsequent time points (green) from the initiation of contraction at the free end of the MTF (yellow arrow, t = 0) that propagates to the base of the MTF (t = 0.16 s) and then relaxes back to it diastolic state (t = 0.36 s). Image processing of the sequence in to track the location of the contractile wave (white ‘*’) based on the position of maximum curvature (smallest radius of curvature). Scale bars are (A) 100 μm, (B) 20 μm and (C,D, and G) 1 mm.
Figure 5
Figure 5
Analysis parameter study. (A,B,C) Calculated stress for a given observed curvature for varying PDMS thickness, cell layer thickness and cell modulus. (A′,B′,C′) For the same parameter variations, the stress-free shortening of the cell layer necessary to generate the observed curvature. Note that cell modulus has virtually no affect on cell stress but has a large affect on stress-free shortening.
Figure 6
Figure 6
Multi-film assay for measurement of vascular smooth muscle contraction. (A) Schematic representation of vMTF assay. (i) MTFs are adhered to PTFE coated posts by hydrophobic interaction with the PDMS. (ii,iii) Radius of curvature of each film can be observed from above. (B) Fluorescent image of eight vMTFs mounted in custom designed petri dish. (C) Thresholded image of vMTFs. (D) Circular fit to thresholded image. (E-G) Films were exposed to 50 nM ET-1 for twenty minutes, starting at time zero. After twenty minutes, 100 μM HA-1077 was added to the solution. (E) Thresholded images of temporal progression of the MTF highlighted in (C). (F) Radii of curvature for the eight vMTFs in (B-D) during treatment. (G) Stress in muscle layer for all vMTFs during the experiment (mean ± standard deviation).

Similar articles

Cited by

References

    1. Rohr S, Scholly DM, Kleber AG. Patterned growth of neonatal rat heart cells in culture. Morphological and electrophysiological characterization. Circ Res. 1991;68:114–30. - PubMed
    1. Gillis AM, Fast VG, Rohr S, Kleber AG. Spatial changes in transmembrane potential during extracellular electrical shocks in cultured monolayers of neonatal rat ventricular myocytes. Circ Res. 1996;79:676–90. - PubMed
    1. Bursac N, Parker KK, Iravanian S, Tung L. Cardiomyocyte cultures with controlled macroscopic anisotropy - A model for functional electrophysiological studies of cardiac muscle. Circ Res. 2002;91:E45–E54. - PubMed
    1. Parker KK, Tan J, Chen CS, Tung L. Myofibrillar architecture in engineered cardiac myocytes. Circ Res. 2008;103:340–2. - PMC - PubMed
    1. Entcheva E, Bien H, Yin LH, Chung CY, Farrell M, Kostov Y. Functional cardiac cell constructs on cellulose-based scaffolding. Biomaterials. 2004;25:5753–62. - PubMed

Publication types