

Epilepsy duration impacts on brain glucose metabolism in temporal lobe epilepsy: results of voxel-based mapping
- PMID: 20149754
- PMCID: PMC10694865
- DOI: 10.1016/j.yebeh.2009.12.007
Epilepsy duration impacts on brain glucose metabolism in temporal lobe epilepsy: results of voxel-based mapping
Abstract
Objective: [(18)F]Fluorodeoxyglucose positron emission tomography ([(18)F]FDG-PET) is a valuable method for detecting focal brain dysfunction associated with epilepsy. Evidence suggests that a progressive decrease in [(18)F]FDG uptake occurs in the epileptogenic cortex with an increase in the duration of epilepsy. In this study, our aim was to use statistical parametric mapping (SPM) to test the validity of this relationship in a retrospective study of patients with temporal lobe epilepsy (TLE).
Methods: [(18)F]FDG-PET scans of 46 adult patients with pharmacoresistant unilateral TLE (25 RTLE and 21 LTLE) were subjected to SPM analysis.
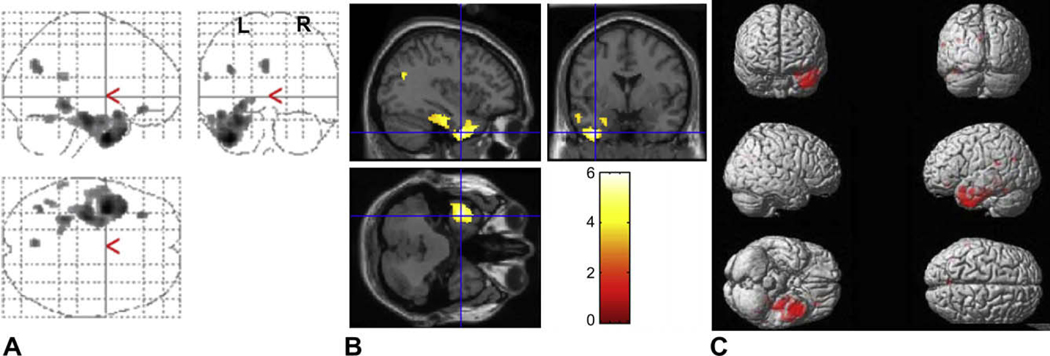
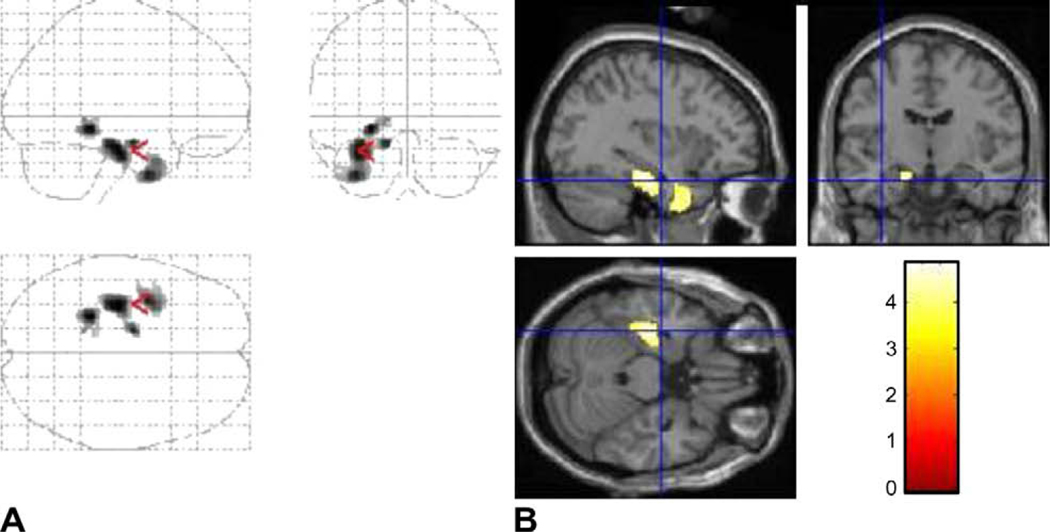
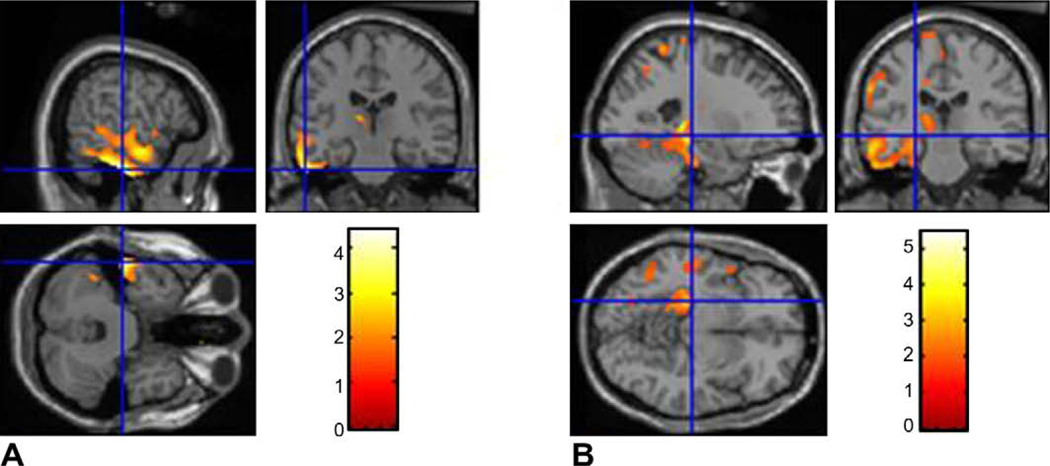
Results: Forty-six patients were diagnosed with nonlesional TLE, 16 of whom had hippocampal sclerosis (HS). The average duration of epilepsy was 17.4 +/- 12.3 years (3-46 years), <5 years in 10 patients and >or=10 years in 30 patients. Visual analysis of [(18)F]FDG-PET scans revealed hypometabolism in the epileptogenic temporal cortex in 31 (67%) patients. After SPM analysis of all [(18)F]FDG-PET images, hypometabolism was unilateral and reported in lateral and mesial structures of the epileptogenic temporal cortex in addition to the ipsilateral fusiform and middle occipital gyrus. Subsequent analysis revealed that temporal lobe hypometabolism was present only in patients with longer epilepsy duration (>or=10 years) in parahippocampal gyrus, uncus, and middle and superior temporal gyrus (P < 0.05 corrected). Epilepsy duration was inversely correlated with decreased glucose uptake in the inferior temporal gyrus, hippocampus, and parahippocampal gyrus of the epileptogenic temporal cortex (P < 0.05). Age at seizure onset did not affect the correlation between epilepsy duration and glucose uptake except in the inferior temporal gyrus (P < 0.05).
Conclusion: Voxel-based mapping supports the assertion that glucose hypometabolism of the epileptogenic temporal lobe cortex and other neighboring cortical regions increases with longer epilepsy duration in TLE.
(c) 2009 Elsevier Inc. All rights reserved.
Conflict of interest statement
Conflict of interest statement
The authors report no conflicts of interest.
Figures
References
-
- Abou-Khalil BW, Siegel GJ, Sackellares JC, Gilman S, Hichwa R, Marshall R. Positron emission tomography studies of cerebral glucose metabolism in chronic partial epilepsy. Ann Neurol 1987;22:480–6. - PubMed
-
- Hajek M, Antonini A, Leenders KL, Wieser HG. Mesiobasal versus lateral temporal lobe epilepsy: metabolic differences in the temporal lobe shown by interictal 18F-FDG positron emission tomography. Neurology 1993;43:79–86. - PubMed
-
- Henry TR, Mazziotta JC, Engel J Jr, et al. Quantifying interictal metabolic activity in human temporal lobe epilepsy. J Cereb Blood Flow Metab 1990;10:748–57. - PubMed
-
- Sackellares JC, Siegel GJ, Abou-Khalil BW, et al. Differences between lateral and mesial temporal metabolism interictally in epilepsy of mesial temporal origin. Neurology 1990;40:1420–6. - PubMed
-
- Theodore WH, Brooks R, Sato S, et al. The role of positron emission tomography in the evaluation of seizure disorders. Ann Neurol 1984;15(Suppl.):S176–9. - PubMed
MeSH terms
Substances
Grants and funding
LinkOut - more resources
Full Text Sources
