. 2010 Apr 7;50(8):810-7.
doi: 10.1016/j.visres.2010.02.003. Epub 2010 Feb 10.

Arrested development: high-resolution imaging of foveal morphology in albinism

Affiliations

Arrested development: high-resolution imaging of foveal morphology in albinism

John T McAllister et al. Vision Res. .

Abstract

Albinism, an inherited disorder of melanin biosynthesis, disrupts normal retinal development, with foveal hypoplasia as one of the more commonly associated ocular phenotypes. However the cellular integrity of the fovea in albinism is not well understood - there likely exist important anatomical differences that underlie phenotypic variability within the disease and that also may affect responsiveness to therapeutic intervention. Here, using spectral-domain optical coherence tomography (SD-OCT) and adaptive optics (AO) retinal imaging, we obtained high-resolution images of the foveal region in six individuals with albinism. We provide a quantitative analysis of cone density and outer segment elongation demonstrating that foveal cone specialization is variable in albinism. In addition, our data reveal a continuum of foveal pit morphology, roughly aligning with schematics of normal foveal development based on post-mortem analyses. Different albinism subtypes, genetic mutations, and constitutional pigment background likely play a role in determining the degree of foveal maturation.


Figures

Fig. 1
Fig. 1
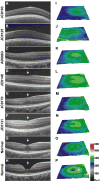
SD-OCT imaging of foveal morphology. (A-H) Linear SD-OCT scans through the central macula in six albinotic subjects (A-F) and two normal controls (G,H). Arrows mark the center of the foveal pit, when present. (I-P) Retinal thickness maps for the six albinotic subjects (I-N) and two normal controls (O,P). All scans are right eye except subject JC0125 (B,J), which is left eye.
Fig. 2
Fig. 2
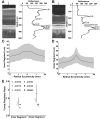
Quantifying cone photoreceptor dimensions with SD-OCT. (A) SD-OCT image at approximately 1.75 mm temporal from the fovea in a normal retina. (B) SD-OCT image near the foveal center in the same retina. Line plots in A & B represent an average of three longitudinal reflectivity profiles (LRP) through the corresponding SD-OCT image at the location of the vertical arrows above each SD-OCT scan. ILM=inner limiting membrane; OPL=outer plexiform layer; ELM=external limiting membrane; IS/OS = inner segment/outer segment junction; RPE1 = outer segment / retinal pigment epithelium interface; RPE2 = retinal pigment epithelium / Bruch's membrane. (C) Plot of normal IS thickness (black line) as a function of retinal location along the horizontal meridian. (D) Plot of normal OS thickness (black line) as a function of retinal location along the horizontal meridian. Shaded gray region in C & D is ±2 SD for the 167 normal controls. (E) Ratio of foveal:peripheral IS and OS lengths. Foveal value taken as the IS (or OS) length at the center of the foveal pit. In the three albinotic retinas with no visible pit, the foveal value was taken at the location of the maximum doming. Peripheral value is an average of the IS (or OS) thickness at 1.75 mm nasal and temporal to the foveal location. The normal mean IS and OS ratios are plotted as horizontal bars, with the error bars representing ±2 SD. Filled symbols represent the IS and OS ratios for the individuals deemed to have no obvious foveal pit on SD-OCT, while open symbols represent ratios for those individuals with a rudimentary pit present on SD-OCT. All but one subject (JC0103) had IS ratios within 2SD of the normal mean, where as only the individuals with visible pits had OS ratios within 2SD of the normal mean.
Fig. 3
Fig. 3
Variability in cone packing in albinism. Shown are images of the cone mosaic centered at approximately 2 degrees superior retina. The foveal center is located just off the left edge of each image. Images from a normal retina (A) and a subject with OCA1B (B) reveal a gradual decrease in cone packing density moving from left (inferior retina) to right (superior retina). Corresponding image from a subject with OA1 (C) reveals more uniform cone packing density. Scale bar is 100 microns. Color panels in A-C are Voronoi diagrams of a central strip through each image. Green color indicates Voronoi domains with 6 sides, reflecting the hexagonal packing of the cone mosaic. Other colors indicate domains with fewer or greater than 6 sides. The gradual decrease in cone packing (A & B) can be seen in the Voronoi diagrams as an increase in the area of the polygons, whereas the image in C has more uniformly-sized polygons. (D), Plot of cone density as a function of retinal location for the mosaics in A-C. (E), Cone density as a function of retinal eccentricity. Filled symbols represent cone density values for albinism patients deemed to have no obvious foveal pit on SD-OCT, while open symbols represent densities for those individuals with a rudimentary pit present on SD-OCT. Only one subject (JC0103) showed a uniform density, the remaining subjects showed some degree of cone packing. Solid black and dashed gray lines represent the mean and minimum/maximum, respectively, of previously published normative data from histology (Curcio, Sloan, Kalina & Hendrickson, 1990).
Fig. 4
Fig. 4
Visualizing melanin pigment clumping. (A-E) Images of the cone mosaic from a subject with OCA1B (JC0140). While a contiguous cone mosaic is clearly visible throughout the images, the images have a mottled appearance. (F) Images of the cone mosaic from a normal control. Cones vary individually in their reflectivity, and there are regional differences in image intensity, but this is in stark contrast to the mottling seen in A-E. Scale bar is 100 microns.

References

    1. Abadi RV, Pascal D. The recognition and management of albinism. Ophthalmic & Physiological Optics. 1989;9:3–15. - PubMed
    1. Akeo K, Shirai S, Okisaka S, Shimizu H, Miyata H, Kikuchi A, Nishikawa T, Suzumori K, Fujiwara T, Majima A. Histology of fetal eyes with oculotaneous albinism. Archives of Ophthalmology. 1996;114:613–616. - PubMed
    1. Baraas RC, Carroll J, Gunther KL, Chung M, Williams DR, Foster DH, Neitz M. Adaptive optics retinal imaging reveals S-cone dystrophy in tritan color-vision deficiency. Journal of the Optical Society of America A. 2007;24(5):1438–1446. - PMC - PubMed
    1. Bennett AG, Rudnicka AR, Edgar DF. Improvements on Littmann's method of determining the size of retinal features by fundus photography. Graefe's Archive for Clinical and Experimental Ophthalmology. 1994;232:361–367. - PubMed
    1. Bixenman WW, Von Noorden GK. Apparent foveal displaceent in normal subjects and in cyclotropia. Ophthalmology. 1982;89:58–62. - PubMed

Publication types