Review
. 2010 Nov;35(2):129-50.
doi: 10.1016/j.neubiorev.2010.02.001. Epub 2010 Feb 10.

Brain reward circuitry beyond the mesolimbic dopamine system: a neurobiological theory

Affiliations
Review

Brain reward circuitry beyond the mesolimbic dopamine system: a neurobiological theory

Satoshi Ikemoto. Neurosci Biobehav Rev. 2010 Nov.

Abstract

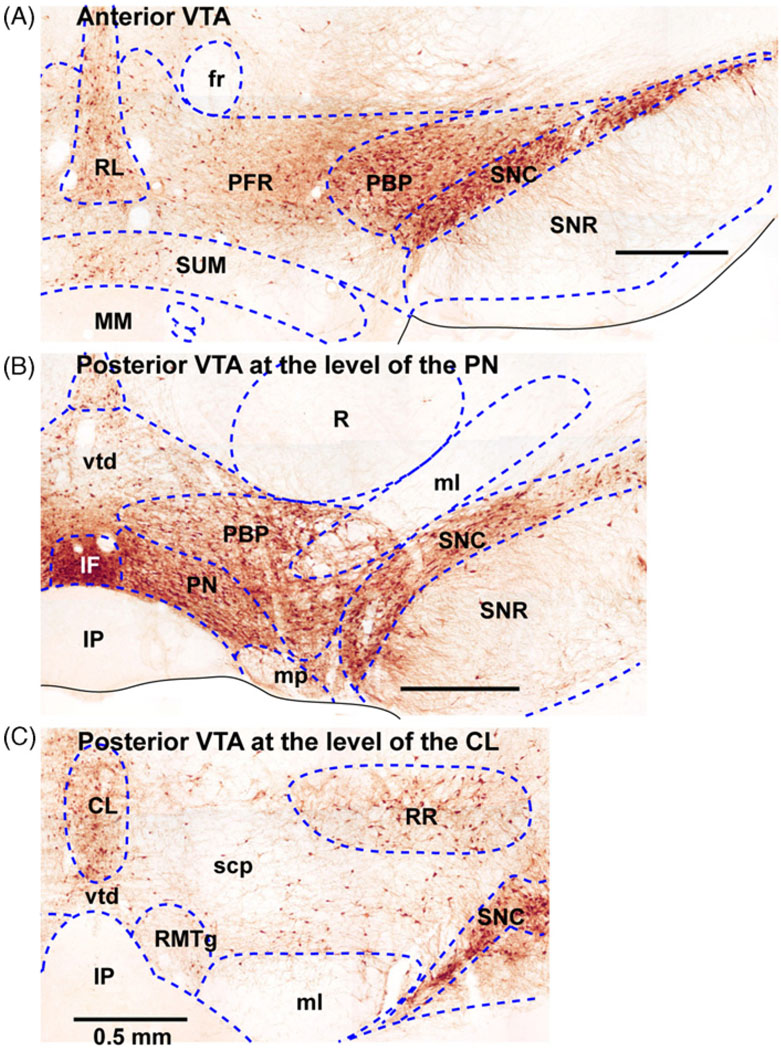
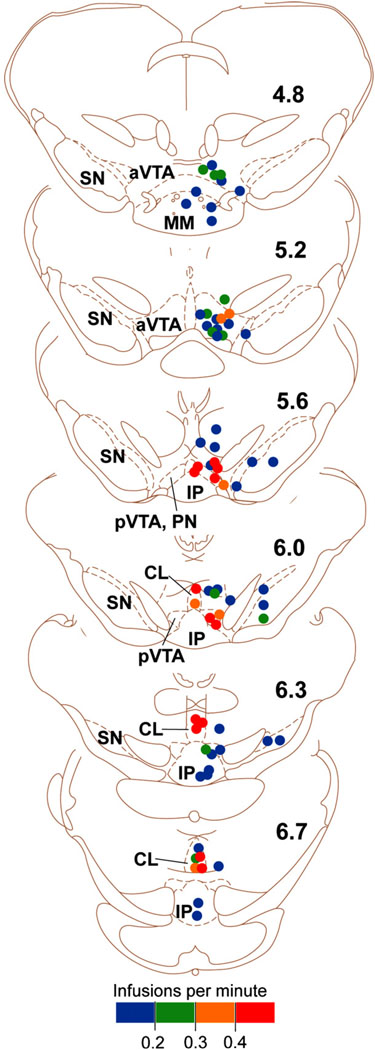
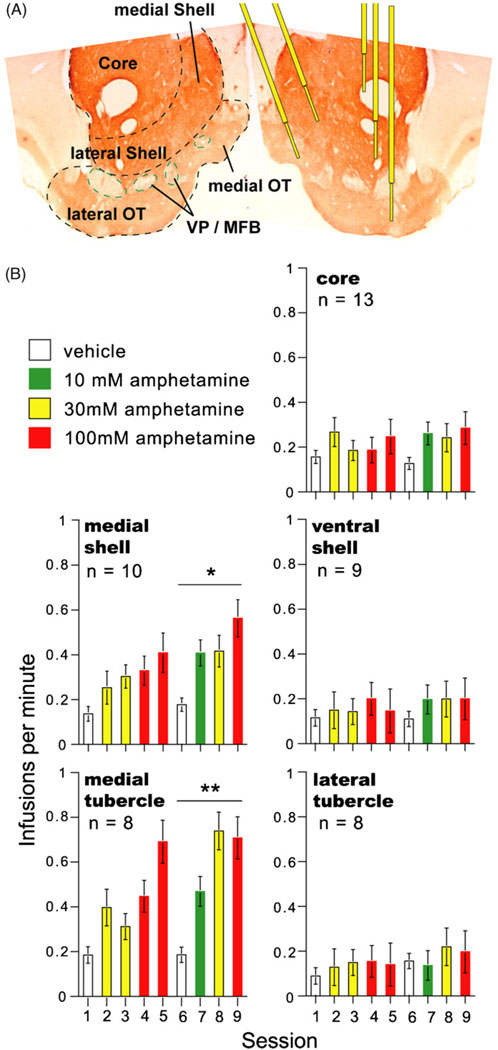
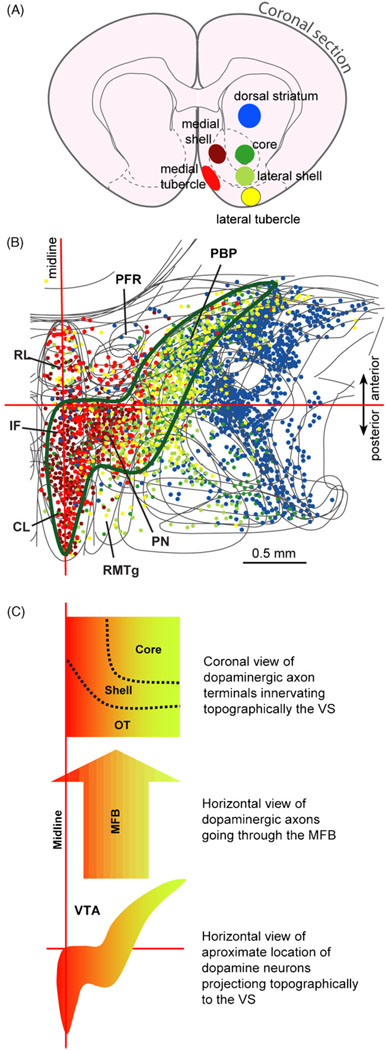
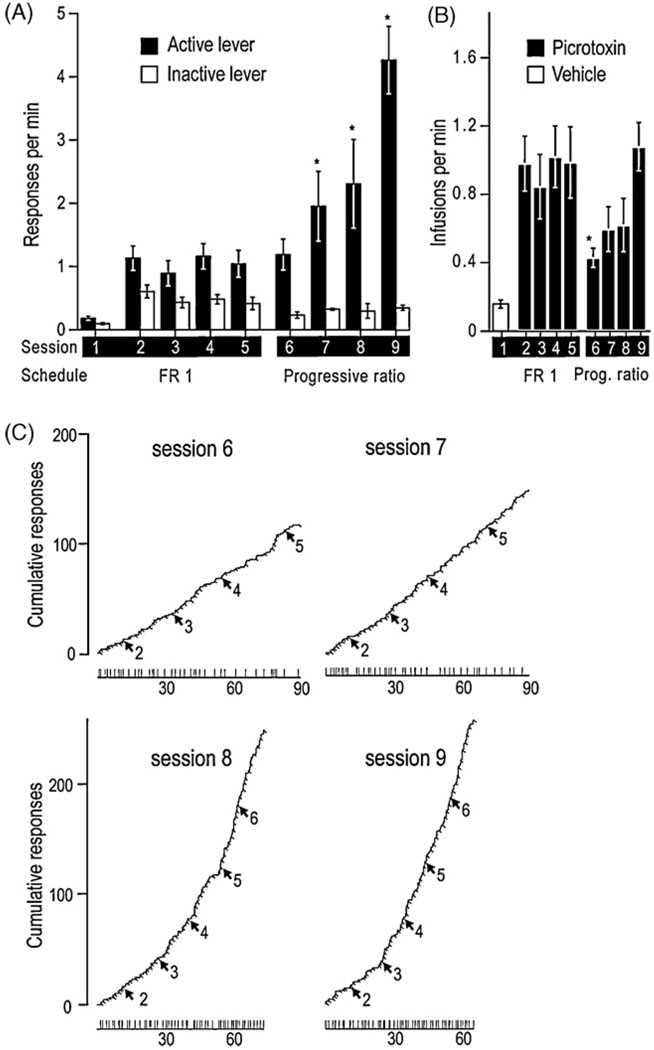
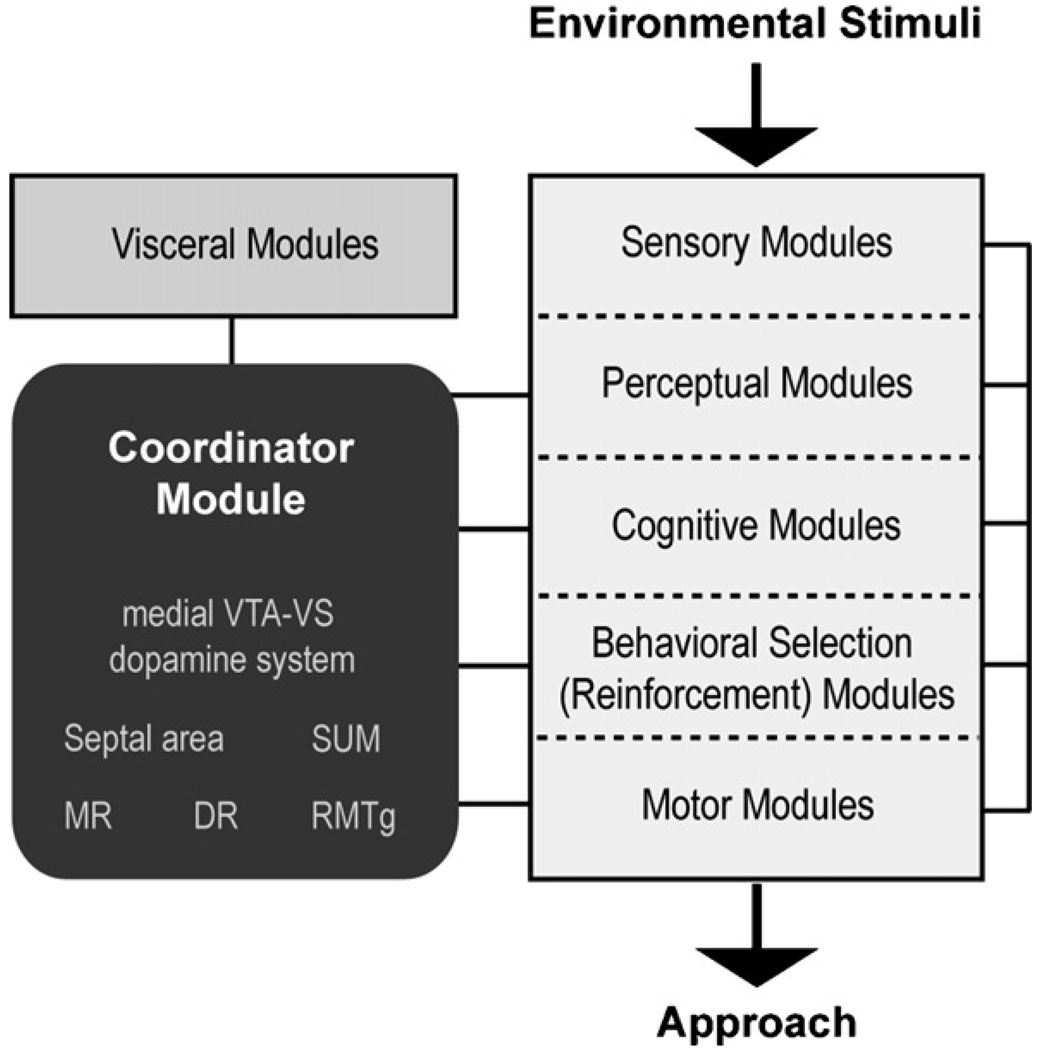
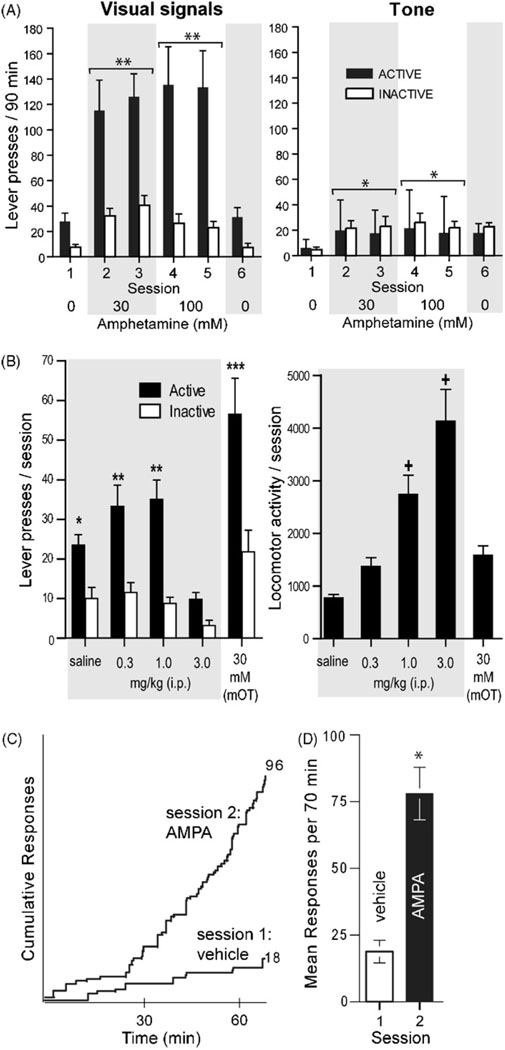
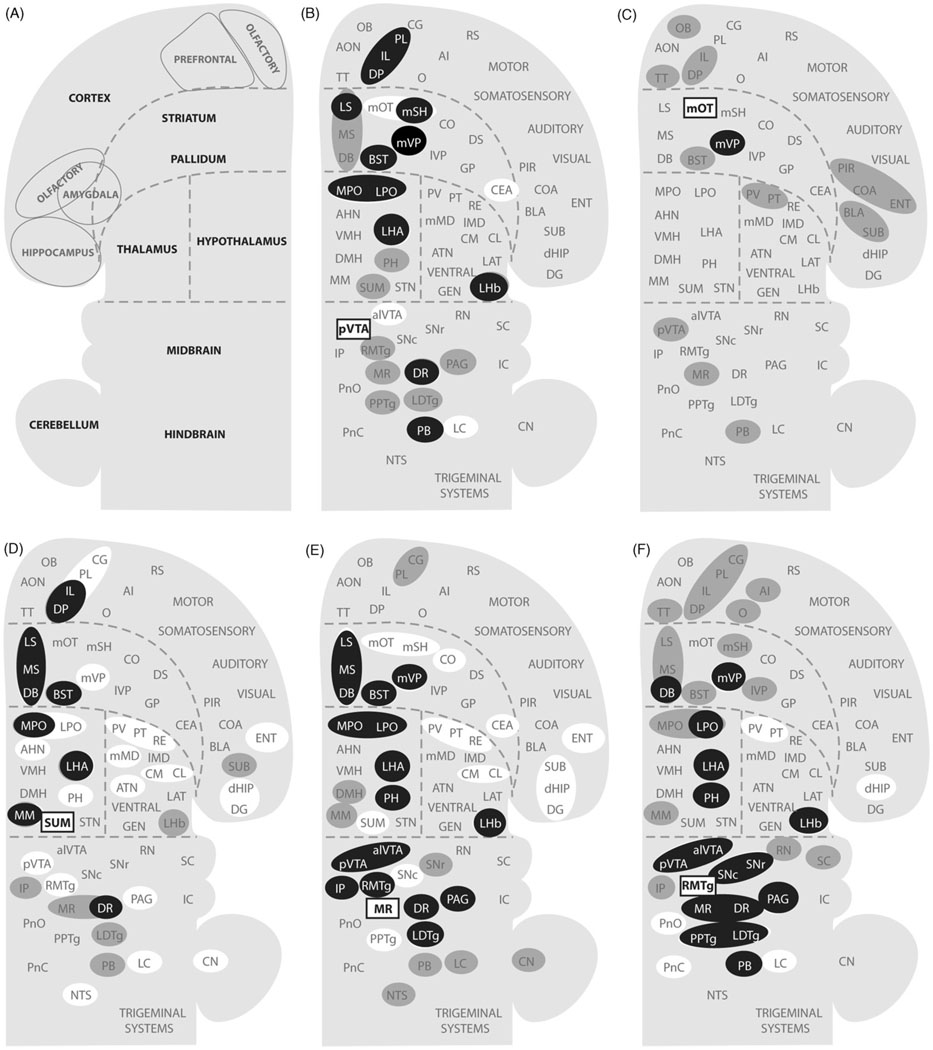
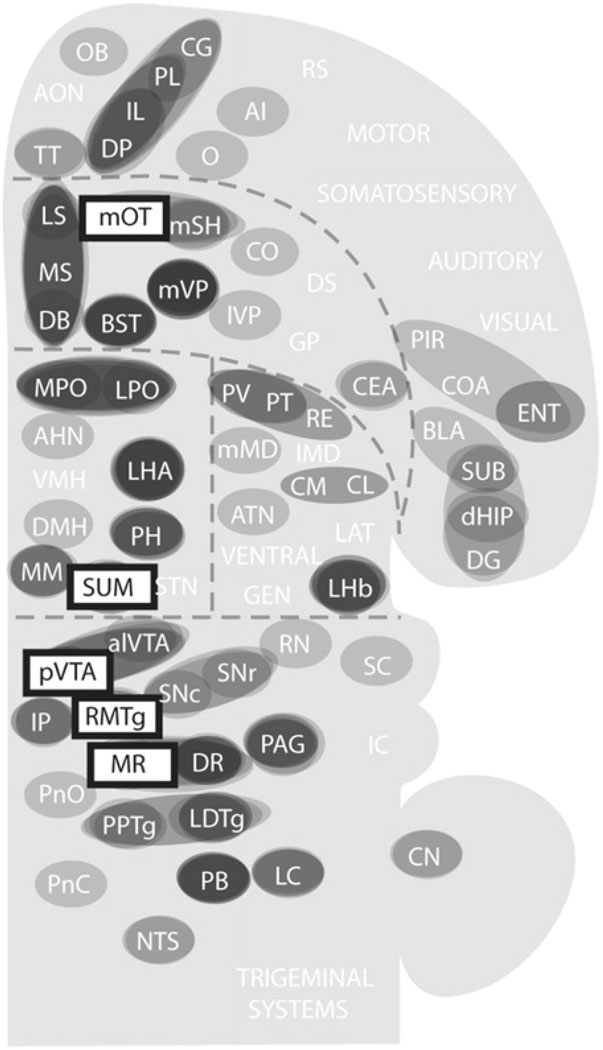
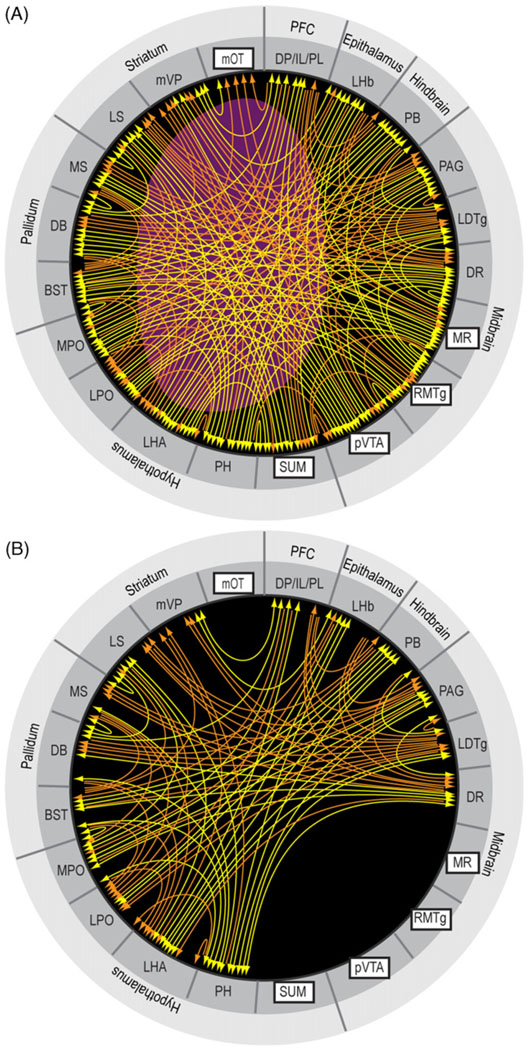
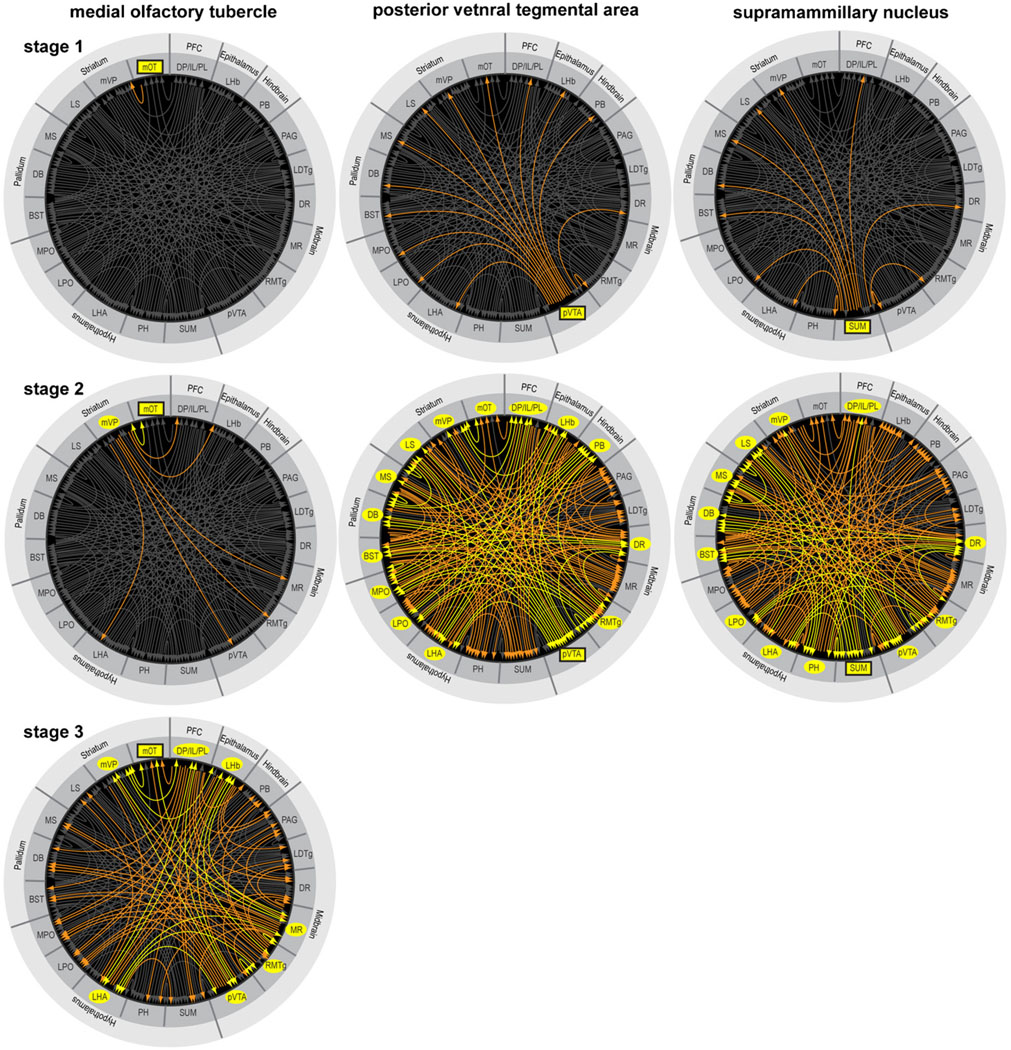
Reductionist attempts to dissect complex mechanisms into simpler elements are necessary, but not sufficient for understanding how biological properties like reward emerge out of neuronal activity. Recent studies on intracranial self-administration of neurochemicals (drugs) found that rats learn to self-administer various drugs into the mesolimbic dopamine structures-the posterior ventral tegmental area, medial shell nucleus accumbens and medial olfactory tubercle. In addition, studies found roles of non-dopaminergic mechanisms of the supramammillary, rostromedial tegmental and midbrain raphe nuclei in reward. To explain intracranial self-administration and related effects of various drug manipulations, I outlined a neurobiological theory claiming that there is an intrinsic central process that coordinates various selective functions (including perceptual, visceral, and reinforcement processes) into a global function of approach. Further, this coordinating process for approach arises from interactions between brain structures including those structures mentioned above and their closely linked regions: the medial prefrontal cortex, septal area, ventral pallidum, bed nucleus of stria terminalis, preoptic area, lateral hypothalamic areas, lateral habenula, periaqueductal gray, laterodorsal tegmental nucleus and parabrachical area.


Figures

Fig. 1
Fig. 1
Coronal sections of the ventral tegmental area. Three sections from the anterior to posterior (A, B and C) are shown to illustrate differential cytoarchitectonic features within the ventral tegmental area. Sections are stained with tyrosine hydroxylase, which indicates dopaminergic neurons in this area of the brain. Abbreviations: CL, central (or caudal) linear nucleus raphe; fr, fasciculus retroflexus; IF, interfascicular nucleus; IP, interpeduncular nucleus; ml, medial lemniscus; PBP, parabrachial pigmented area; PFR, parafasciculus retroflexus area; PN, paranigral nucleus; R, red nucleus; RL, rostral linear nucleus raphe; RR, retrorubral nucleus; scp, superior cerebellar peduncle; SNC, substantia nigra compact part; SNR, substantia nigra reticular part; SUM, supramammillary nucleus; vtd, ventral tegmental decussation.
Fig. 2
Fig. 2
Effectiveness of nicotine self-administration into the ventral tegmental area. Each dot on the coronal sections summarizes self-administration data from a single rat. Its color indicates the rate of self-administration of nicotine at the site. The numbers on the right indicate distances (mm) from bregma. The figure is modified from the one originally presented in the Ikemoto et al. study (2006) and presented with permission from the Society for Neuroscience. Drawings are adapted and modified from the rat atlas by Paxinos and Watson (1997). Abbreviations: aVTA, anterior ventral tegmental area; CL, central (or caudal) linear nucleus raphe; IP, interpeduncular nucleus; pVTA, posterior ventral tegmental area; SN, substantia nigra.
Fig. 3
Fig. 3
The ventral striatum and self-administration of amphetamine. (A) Divisions of the ventral striatum and cannula placements are shown on the right and left, respectively. The coronal section is stained with tyrosine hydroxylase. (B) Mean self-administration rates for the five subregions of the ventral striatum. During sessions 6–9, rats receiving amphetamine into the medial olfactory tubercle and medial shell self-administered at greater rates than those receiving the drug into the lateral tubercle, lateral shell, or core, *P < 0.05 and **P < 0.01. The figure is modified from one originally presented in the Ikemoto et al. study (2005) and presented with permission from the Society for Neuroscience.
Fig. 4
Fig. 4
Topographic projection of midbrain dopamine neurons to the ventral striatum. (A) The retrograde tracer Fluorogold was iontophoretically injected into the subregions of the ventral striatum and dorsal striatum. Different colors are used to distinguish injection sites from each other. (B) Retrogradely labeled neurons were plotted on horizontal sections of the ventral midbrain. Each dot represents a neuron retrogradely-labeled by one of the injection sites (color coded). Approximate area that provides dopaminergic projection to the ventral striatum is outlined by green line. See the legend of Figure 1 for abbreviations. (C) Highly schematic drawing shows mediolateral topography of dopamine neuron projection between the VTA and ventral striatum. The figure is modified from one originally presented in the review (Ikemoto, 2007) and presented with permission from Elsevier.
Fig. 5
Fig. 5
Effects of a progressive ratio schedule on supramammillary injections of picrotoxin. Four rats received vehicle in session 1 and picrotoxin (0.1 mM) in sessions 2–9. They were trained on operant conditioning schedules of a fixed-ratio 1 with a 20 s timeout in sessions 1–5 and a partial progressive ratio (up to 6) in sessions 6–9. (A) Mean response rates (±SEM) of the two levers are summarized over nine sessions. Active lever-presses in each of sessions 7, 8, and 9 were greater than inactive lever-presses in respective sessions, and they were also greater than active lever-presses in each of sessions 2, 3, 4, and 5 (*P < 0.05). (B) Mean infusion rates (±SEM) are shown over nine sessions. The infusions in session 6, when the progressive ratio schedule was introduced, were lower than those in sessions 2,4, and 5 (*P < 0.05). (C) Cumulative response records and infusion event records of a representative rat are shown. Each line moves up a unit vertically every time the rat pressed the active lever. Each perpendicular slit indicates the point of an infusion delivery. Each arrow accompanied by a number indicates the point at which the response requirement was incremented, and the number indicates required lever-presses for each infusion. The horizontal lines in the bottom indicate session length with vertical lines again indicating the points of infusions delivered. The figure is modified from one originally presented in the Ikemoto study (2005) and presented with permission from Nature Publishing Group.
Fig. 6
Fig. 6
Conceptual scheme involving modules for voluntary behavior controlled by rewards. The affective arousal module interacts with other modules to alter voluntary behavior.
Fig. 7
Fig. 7
Facilitation of responding for unconditioned visual signals by rewarding manipulations. (A) Upon active lever pressing, the visual signal group (N = 8) received an illumination of the cue lamp just above the lever for 1 s and an extinction of the house lamp for 7 s, whereas the tone group (N = 8) received a 1 s tone. Both groups received noncontingent infusions (100 nl per infusion) on a fixed 90-s interval schedule. Lights, but not tone stimuli, support robust lever-pressing in the presence of amphetamine. Data are means ± SEM. *P < 0.05, **P < 0.005, significantly greater than vehicle values. (B) Rats (N = 13) received systemic injections of vehicle or amphetamine (0.3, 1, and 3 mg/kg, i.p.) just prior to each session, except that in the last session, they received noncontingent intra-tubercle amphetamine (30 mM; 78 nl per infusion). *P < 0.001, significantly greater than its inactive lever presses and the active lever presses of the 3 mg/kg session. **P < 0.005, significantly greater than its inactive lever presses and the active lever presses of the saline session. ***P < 0.0005, significantly greater than its inactive lever presses and the active lever presses of all other sessions. +P < 0.005, significantly greater than the values of the saline, 0.3 mg/kg and intra-tubercle sessions. (C) AMPA administration into the SUM facilitates lever-pressing reinforced by visual signals. Each rat was placed in a test chamber and received noncontingent infusions into the SUM. Infusions (75 nl per infusion) of vehicle and 0.3 mM AMPA were administered on a fixed interval schedule of 70 s (total infusion of 60 over 70 min) in sessions 1 and 2, respectively. Sessions were separated by 24 h. The infusion rate of noncontingent administration of AMPA mimicked the rate of self-administration conducted using a similar procedure (Ikemoto et al., 2004). During these sessions, each lever-press illuminated a cue-light just above the lever for 5 s. The left panel depicts response patterns of a representative rat during sessions. Numbers on the right indicate total numbers of responding. The right panel depicts mean leverpresses (N = 7) with SEM in sessions 1 and 2. *P < 0.01, significantly different from vehicle values.
Fig. 8
Fig. 8
Afferents to and efferents from the trigger zones. (A) Schematic drawing shows a flat map adopted and modified from the one by Swanson (2004). (B–F) Afferents to the trigger zones, indicated by rectangular boxes, are shown in gray shade, while efferents from the trigger zones are shown in white. Black-filled circles indicate regions that are reciprocally connected with the trigger zones. Abbreviations: AHN, anterior hypothalamic nucleus; AI, agranular insular cortex; alVTA, anterolateral ventral tegmental area; ATN, anterior nuclei, dorsal thalamus; BLA, basolateral amygdalar nucleus; BST, bed nucleus of stria terminalis; CEA, central amygdalar nucleus; CG, cingulate cortex; CL, centrolateral thalamic nucleus; CM, central medial thalamic nucleus; CN, cerebellar nuclei; CO, core of the nucleus accumbens; COA, cortical amygdalar nucleus; DB, diagonal band of Broca; dHIP, dorsal hippocampus; DG, dentate gyrus; DMH, dorsomedial hypothalamic nucleus; DP, dorsal peduncular cortex; DR, dorsal raphe nucleus; DS, dorsal striatum; ENT, entorhinal area; GEN, geniculate thalamic nuclei; GP, globus pallidus; IC, inferior colliculus; IL, infralimbic cortex; lMD, intermediodorsal thalamic nucleus; IP, interpeduncular nucleus; lVP, lateral ventral pallidum; LAT, lateral nuclei, dorsal thalamus; LC, locus coeruleus; LDTg, laterodorsal tegmental nucleus; LHA, lateral hypothalamic area; LHb, lateral habenular nucleus; LPO, lateral preoptic area; LS, lateral septal area; MM, medial mammillary nucleus; mMD, medial mediodorsal thalamic nucleus; MPO, medial preoptic area; MR, median raphe nucleus; MS, medial septal area; mSH, medial shell of the nucleus accumbens; mOT, medial olfactory tubercle; mVP, medial ventral pallidum; NTS, nucleus of the solitary tract; O, orbital area; PAG, periaqueductal gray; PB, parabrachical nucleus; PIR, piriform cortex; PH, posterior hypothalamic nucleus; PL, prelimbic cortex; PnC, pontine reticular nucleus, caudal part; PnO, pontine reticular nucleus, oral part; PPTg, pedunculopontine tegmental nucleus; PT, paratenial thalamic nucleus; PV, paraventricular thalamic nucleus; pVTA, posterior ventral tegmental area; RE, reuniens thalamic nucleus; RMTg, reostromedial tegmental nucleus; RN, red nucleus; RS, retrosplenial cortex; SNr, substantia nigra, reticular part; SNc, substantia nigra, compact part; STN, subthalamic nucleus; SUB, subiculum; SUM, SUM; SC, superior colliculus; TT, tenia tecta; VMH, ventromedial hypothalamic nucleus.
Fig. 9
Fig. 9
Regions that are closely connected with the trigger zones for reward. Shades of gray are darker if the region is connected to multiple trigger zones. See Fig. 8 legend for abbreviations.
Fig. 10
Fig. 10
Hypothesized key components of brain reward circuitry and its organization. Afferents and efferents of key components of the circuitry are shown with orange lines for unidirectional connection and yellow lines for reciprocal connections. (A) The purple area corresponds to the medial forebrain bundle, at which electrical stimulation elicits vigorous self-stimulation. This depicts a tentative organization of brain reward circuitry at a macroscale level. (B) The connectivity of the circuitry after removing the trigger zones. See the legend of Fig. 8 for abbreviations.
Fig. 11
Fig. 11
Sequences through which tonic activity of the approach coordinating module could be altered by local drug injections into the medial olfactory tubercle, VTA or SUM.

Similar articles

Cited by

References

    1. Albert R, Jeong H, Barabasi A-L. Error and attack tolerance of complex networks. Nature. 2000;406:378–382. - PubMed
    1. Alexander GE, DeLong MR, Strick PL. Parallel organization of functionally segregated circuits linking basal ganglia and cortex. Annu. Rev. Neurosci. 1986;9:357–381. - PubMed
    1. Allen CN, Crawford IL. GABAergic agents in the medial septal nucleus affect hippocampal theta rhythm and acetylcholine utilization. Brain Res. 1984;322:261–267. - PubMed
    1. Alstott J, Breakspear M, Hagmann P, Cammoun L, Sporns O. Modeling the impact of lesions in the human brain. PLoS Comput. Biol. 2009;5:e1000408. - PMC - PubMed
    1. Araki M, McGeer PL, Kimura H. The efferent projections of the rat lateral habenular nucleus revealed by the PHA-L anterograde tracing method. Brain Res. 1988;441:319–330. - PubMed

Publication types