. 2010 May;170(2):270-7.
doi: 10.1016/j.jsb.2010.02.002. Epub 2010 Feb 10.

The effects of PKCalpha phosphorylation on the extensibility of titin's PEVK element

Affiliations

The effects of PKCalpha phosphorylation on the extensibility of titin's PEVK element

Brian R Anderson et al. J Struct Biol. 2010 May.

Abstract

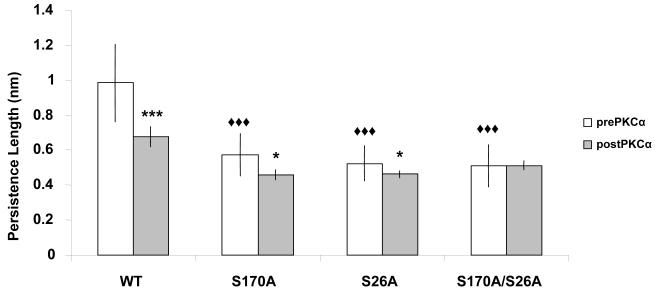
Post-translational modifications, along with isoform splicing, of titin determine the passive tension development of stretched sarcomeres. It was recently shown that PKCalpha phosphorylates two highly-conserved residues (S26 and S170) of the PEVK region in cardiac titin, resulting in passive tension increase. To determine how each phosphorylated residue affects myocardial stiffness, we generated three recombinant mutant PEVK fragments (S26A, S170A and S170A/S26A), each flanked by Ig domains. Single-molecule force spectroscopy shows that PKCalpha decreases the PEVK persistence length (from 0.99 to 0.68 nm); the majority of this decrease is attributable to phosphorylation of S26. Before PKCalpha, all three mutant PEVK fragments showed at least 40% decrease in persistence length compared to wildtype. Furthermore, Ig domain unfolding force measurements indicate that PEVK's flanking Ig domains are relatively unstable compared to other titin Ig domains. We conclude that phosphorylation of S26 is the primary mechanism through which PKCalpha modulates cardiac stiffness.


Figures

Figure 1
Figure 1. Single molecule force spectroscopy of PEVK
A) The I-band of the cardiac titin N2B isoform. Single molecule force spectroscopy was performed on recombinant protein fragments containing the PEVK domain and flanking Ig domains. B) Schematic of the AFM experiment. When the cantilever tip tethers our recombinant protein, force develops in the molecule (which bends the tip) as the tip retracts from the surface. Initially, the PEVK element extends (event 1), which generates the force trace leading up to the first force peak. When sufficient force develops, an Ig domain unfolds (event 2), and a distinct force peak develops. This unfolding event increases the CL of the molecule, which reduces the force in the system immediately after Ig domain unfolding. The second force peak is due to unfolding of the other Ig domain, and the third force peak is due to molecular displacement from either the tip or slide. C) We fit the trace leading up to the first force peak with the WLC equation to determine PEVK resistance to stretch. The force peak at low extensions (< 25 nm) is due to the adhesive force between the cantilever tip and slide surface and is excluded from our WLC fits.
Figure 2
Figure 2. AFM force-extension curves
Sample force-extension curves for all four PEVK fragments pre-PKCα phosphorylation: A) WT; B) S170A/S26A; C) S170A; D) S26A. The trace leading up to the first force peak is fit with the WLC equation to extract the PL and CL of PEVK. The force peaks at short extension are due to adhesion between slide surface and cantilever tip, and are excluded from our fits. Note that all peaks have the three-peak “fingerprint” characteristic of an extension-retraction cycle stretching only one Ig-PEVK-Ig molecule.
Figure 3
Figure 3. PEVK PL measurements
Average PL for WT, S170A, S26A, and S170A/S26A fragments, pre- and post-PKCα phosphorylation. Each mutated PEVK shows a significant decrease in PL compared to WT, although there is no significance among mutants. Post-PKCα, all fragments except the double mutant have decreased PL. This shows that S26 and S170 are the only two residues that influence PEVK mechanics following PKCα phosphorylation. This also supports the notion that there are only two PKCα substrates in the PEVK region. (◆: significant vs. pre-PKCα WT; *: significant vs. pre-PKCα for given PEVK group; three symbols, p < 0.001; one symbol, p < 0.05).
Figure 4
Figure 4. PEVK CL measurements
PEVK CL is determined from fitting the trace up to the first force peak with the WLC equation. Prior to PKCα, there is no significant difference between PEVK fragments. After phosphorylation, WT and S170A PEVK exhibit significant decrease in CL. The addition of PO42− to S26 and S170 likely reduces CL via attractive interactions between phosphoserine and positively-charged residues/PEVK repeat motifs. A mild competitive effect from phosphorylated S170 may explain why a slightly larger CL decrease is measured in S170A compared to WT. (*: significant between pre- and post-PKCα sets of a given PEVK group; two symbols, p < 0.01; one symbol, p < 0.05. There are no significant differences due to mutations alone).
Figure 5
Figure 5. CL gain following Ig unfolding
To determine the average CL gain following Ig domain unfolding, we plot mean CL vs. force peak number. After both Ig domains unfold, force still develops as the cantilever is retracted because the molecule is still anchored to the slide surface and cantilever tip. The third force peak in our force-extension traces is due to the molecule de-adsorbing from either or both of its anchoring contact points, which is a stochastic process. Therefore, a well-defined force peak may not always develop due to premature displacement of the molecule from slide or tip. To accurately measure the CL gain between peaks 2 and 3, we disregarded force-extension curves that did not contain a third force peak that could be well-fit with the WLC equation. A) Pre-PKCα, the mean CL gain due to Ig unfolding for WT, S170A, S26A, and S170A/S26A is 23.4, 23.9, 24.6, and 23.5 nm, respectively, with no significance between groups. B) Post-PKCα, the mean CL gain for WT, S170A, S26A, and S170A/S26A is 24.3, 26.9, 28.2, and 25.3, respectively, again with no significance between groups. In addition, there is no significance pre- and post-PKCα for a given group.
Figure 6
Figure 6. The effect of PKCα on titin-based passive tension in the sarcomere
To determine how changes in PEVK PL and CL alter the resistance to stretch of an entire titin molecule, we use an inverted WLC equation to sum the relative extensions of all three I-band elements at a given force. For a single titin molecule (cardiac N2B isoform), PKCα phosphorylation increases the force needed to extend titin at a given length. At SL ~ 2.2 μm, we calculate that PKCα phosphorylation increases passive force by 15%.

References

    1. Furst DO, et al. The organization of titin filaments in the half-sarcomere revealed by monoclonal antibodies in immunoelectron microscopy: a map of ten nonrepetitive epitopes starting at the Z line extends close to the M line. J Cell Biol. 1988;106(5):1563–72. - PMC - PubMed
    1. Horowits R, et al. A physiological role for titin and nebulin in skeletal muscle. Nature. 1986;323(6084):160–4. - PubMed
    1. Labeit S, Kolmerer B. Titins: giant proteins in charge of muscle ultrastructure and elasticity. Science. 1995;270(5234):293–6. - PubMed
    1. Granzier HL, Labeit S. Titin and its associated proteins: the third myofilament system of the sarcomere. Adv Protein Chem. 2005;71:89–119. - PubMed
    1. Freiburg A, et al. Series of exon-skipping events in the elastic spring region of titin as the structural basis for myofibrillar elastic diversity. Circ Res. 2000;86(11):1114–21. - PubMed

Publication types

MeSH terms