Transformations in oscillatory activity and evoked responses in primary somatosensory cortex in middle age: a combined computational neural modeling and MEG study
- PMID: 20149881
- PMCID: PMC2894272
- DOI: 10.1016/j.neuroimage.2010.02.004
Transformations in oscillatory activity and evoked responses in primary somatosensory cortex in middle age: a combined computational neural modeling and MEG study
Abstract
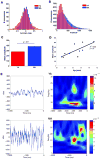
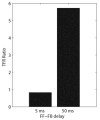
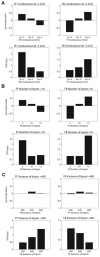
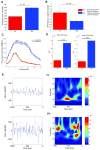
Oscillatory brain rhythms and evoked responses are widely believed to impact cognition, but relatively little is known about how these measures are affected by healthy aging. The present study used MEG to examine age-related changes in spontaneous oscillations and tactile evoked responses in primary somatosensory cortex (SI) in healthy young (YA) and middle-aged (MA) adults. To make specific predictions about neurophysiological changes that mediate age-related MEG changes, we applied a biophysically realistic model of SI that accurately reproduces SI MEG mu rhythms, containing alpha (7-14 Hz) and beta (15-30 Hz) components, and evoked responses. Analyses of MEG data revealed a significant increase in prestimulus mu power in SI, driven predominately by greater mu-beta dominance, and a larger and delayed M70 peak in the SI evoked response in MA. Previous analysis with our computational model showed that the SI mu rhythm could be reproduced with a stochastic sequence of rhythmic approximately 10 Hz feedforward (FF) input to the granular layers of SI (representative of lemniscal thalamic input) followed nearly simultaneously by approximately 10 Hz feedback (FB) input to the supragranular layers (representative of input from high order cortical or non-specific thalamic sources) (Jones et al., 2009). In the present study, the model further predicted that the rhythmic FF and FB inputs become stronger with age. Further, the FB input is predicted to arrive more synchronously to SI on each cycle of the 10 Hz input in MA. The simulated neurophysiological changes are sufficient to account for the age-related differences in both prestimulus mu rhythms and evoked responses. Thus, the model predicts that a single set of neurophysiological changes intimately links these age-related changes in neural dynamics.
Copyright (c) 2010 Elsevier Inc. All rights reserved.
Figures


Similar articles
-
Quantitative analysis and biophysically realistic neural modeling of the MEG mu rhythm: rhythmogenesis and modulation of sensory-evoked responses.J Neurophysiol. 2009 Dec;102(6):3554-72. doi: 10.1152/jn.00535.2009. Epub 2009 Oct 7. J Neurophysiol. 2009. PMID: 19812290 Free PMC article.
-
Neural correlates of tactile detection: a combined magnetoencephalography and biophysically based computational modeling study.J Neurosci. 2007 Oct 3;27(40):10751-64. doi: 10.1523/JNEUROSCI.0482-07.2007. J Neurosci. 2007. PMID: 17913909 Free PMC article.
-
Neuronal Modeling of Cross-Sensory Visual Evoked Magnetoencephalography Responses in the Auditory Cortex.J Neurosci. 2024 Apr 24;44(17):e1119232024. doi: 10.1523/JNEUROSCI.1119-23.2024. J Neurosci. 2024. PMID: 38508715 Free PMC article.
-
Multielectrode Recordings in the Somatosensory System.In: Nicolelis MAL, editor. Methods for Neural Ensemble Recordings. 2nd edition. Boca Raton (FL): CRC Press/Taylor & Francis; 2008. Chapter 6. In: Nicolelis MAL, editor. Methods for Neural Ensemble Recordings. 2nd edition. Boca Raton (FL): CRC Press/Taylor & Francis; 2008. Chapter 6. PMID: 21204443 Free Books & Documents. Review.
-
Magnetoencephalography in the study of human somatosensory cortical processing.Philos Trans R Soc Lond B Biol Sci. 1999 Jul 29;354(1387):1145-54. doi: 10.1098/rstb.1999.0470. Philos Trans R Soc Lond B Biol Sci. 1999. PMID: 10466142 Free PMC article. Review.
Cited by
-
Dynamics of dynamics within a single data acquisition session: variation in neocortical alpha oscillations in human MEG.PLoS One. 2011;6(9):e24941. doi: 10.1371/journal.pone.0024941. Epub 2011 Sep 22. PLoS One. 2011. PMID: 21966388 Free PMC article.
-
Direction of magnetoencephalography sources associated with feedback and feedforward contributions in a visual object recognition task.Neurosci Lett. 2015 Jan 12;585:149-54. doi: 10.1016/j.neulet.2014.11.029. Epub 2014 Nov 20. Neurosci Lett. 2015. PMID: 25445356 Free PMC article.
-
Mindfulness starts with the body: somatosensory attention and top-down modulation of cortical alpha rhythms in mindfulness meditation.Front Hum Neurosci. 2013 Feb 13;7:12. doi: 10.3389/fnhum.2013.00012. eCollection 2013. Front Hum Neurosci. 2013. PMID: 23408771 Free PMC article.
-
Non-zero mean alpha oscillations revealed with computational model and empirical data.PLoS Comput Biol. 2022 Jul 8;18(7):e1010272. doi: 10.1371/journal.pcbi.1010272. eCollection 2022 Jul. PLoS Comput Biol. 2022. PMID: 35802619 Free PMC article.
-
The link between executive skills and neural dynamics during encoding, inhibition, and retrieval of visual information in the elderly.Hum Brain Mapp. 2024 Aug 15;45(12):e26755. doi: 10.1002/hbm.26755. Hum Brain Mapp. 2024. PMID: 39185717 Free PMC article.
References
-
- Adler G, Nacimiento AC. Age-dependent changes of short-latency somatosensory evoked potentials in healthy adults. Appl Neurophysiol. 1988;51:55–9. - PubMed
-
- Ahmad A, Spear PD. Effects of aging on the size, density, and number of rhesus monkey lateral geniculate neurons. J Comp Neurol. 1993;334:631–43. - PubMed
-
- Babiloni C, Binetti G, Cassarino A, Dal Forno G, Del Percio C, Ferreri F, Ferri R, Frisoni G, Galderisi S, Hirata K, Lanuzza B, Miniussi C, Mucci A, Nobili F, Rodriguez G, Luca Romani G, Rossini PM. Sources of cortical rhythms in adults during physiological aging: A multicentric EEG study. Hum Brain Mapp. 2006;27:162–72. - PMC - PubMed
-
- Brunso-Bechtold JK, Linville MC, Sonntag WE. Age-related synaptic changes in sensorimotor cortex of the brown norway x fischer 344 rat. Brain Res. 2000;872:125–33. - PubMed
-
- Cabeza R. Hemispheric asymmetry reduction in older adults: The harold model. Psychol Aging. 2002;17:85–100. - PubMed
Publication types
MeSH terms
Grants and funding
LinkOut - more resources
Full Text Sources
Medical
Research Materials

