

Long-term dietary restriction influences plasma ghrelin and GOAT mRNA level in rats
- PMID: 20149910
- PMCID: PMC3827011
- DOI: 10.1016/j.physbeh.2010.01.034
Long-term dietary restriction influences plasma ghrelin and GOAT mRNA level in rats
Abstract
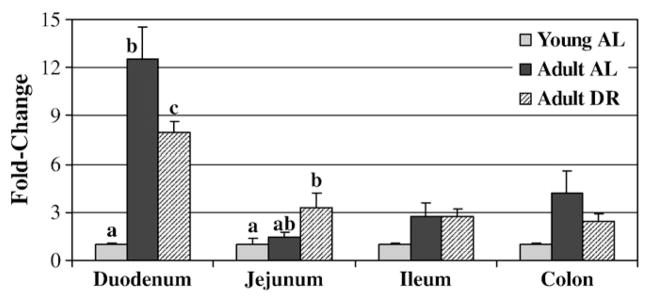
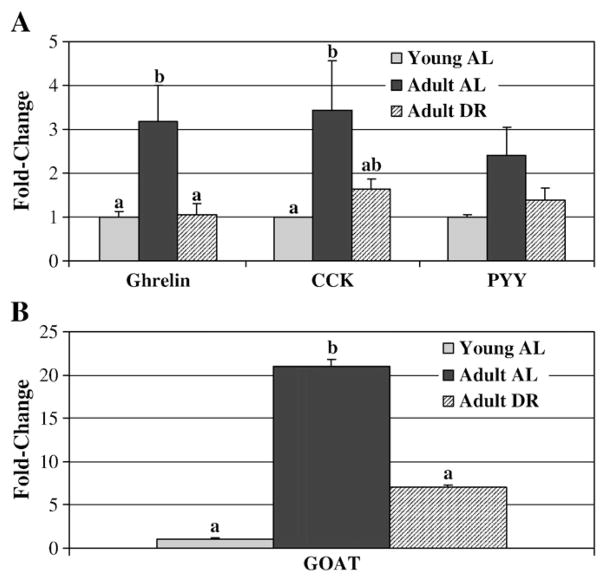
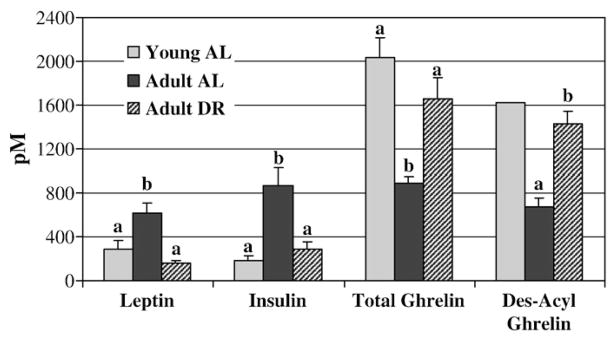
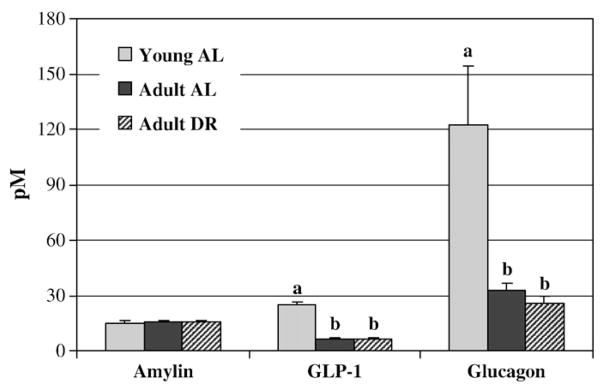
The objective of this study was to examine the effect of chronic dietary restriction on the physical characteristics of the intestine and gut-derived satiety hormone production. Male Wistar rats (8 weeks) were randomized to ad libitum (AL) or 35% dietary restriction (DR) for 5 months. At the end of the study, physical measurements were made on the intestine and satiety hormone secretion and mRNA expression determined. A comparison group of young, growing AL rats (5 weeks) was also examined. The adult DR rats gained less weight over 5 months and had lower fat mass than adult AL rats (p<0.05). The weight of the small intestine as a percentage of total body weight was greater in adult DR compared to adult AL but lower than young AL rats. Compared to AL, DR down-regulated proglucagon and cholecystokinin mRNA in the duodenum and ghrelin mRNA in the stomach of adult rats but was not different from young AL. Ghrelin-O-acyltransferase (GOAT) mRNA in the stomach was up-regulated 21-fold in adult AL rats compared to young AL and 14-fold compared to adult DR rats. Total and des-acyl ghrelin was approximately 50% higher in adult DR and young AL rats compared to adult AL. Plasma leptin and insulin were lower in adult DR and young AL rats compared to adult AL. Our findings suggest that long-term energy deficits continue to drive up ghrelin levels which may have profound implications for practical implementation of DR as an anti-aging or anti-obesity strategy in humans.
(c) 2010 Elsevier Inc. All rights reserved.
Figures
Similar articles
-
Prebiotic fibres dose-dependently increase satiety hormones and alter Bacteroidetes and Firmicutes in lean and obese JCR:LA-cp rats.Br J Nutr. 2012 Feb;107(4):601-13. doi: 10.1017/S0007114511003163. Epub 2011 Jul 18. Br J Nutr. 2012. PMID: 21767445 Free PMC article.
-
Differential secretion of satiety hormones with progression of obesity in JCR:LA-corpulent rats.Obesity (Silver Spring). 2008 Apr;16(4):736-42. doi: 10.1038/oby.2007.128. Epub 2008 Jan 24. Obesity (Silver Spring). 2008. PMID: 18239578 Free PMC article.
-
Influence of chronic undernutrition and leptin on GOAT mRNA levels in rat stomach mucosa.J Mol Endocrinol. 2008 Dec;41(6):415-21. doi: 10.1677/JME-08-0102. Epub 2008 Oct 3. J Mol Endocrinol. 2008. PMID: 18835978
-
Effect of feed restriction and supplemental dietary fat on gut peptide and hypothalamic neuropeptide messenger ribonucleic acid concentrations in growing wethers.J Anim Sci. 2010 Feb;88(2):737-48. doi: 10.2527/jas.2009-2316. Epub 2009 Nov 6. J Anim Sci. 2010. PMID: 19897637
-
Ghrelin O-acyltransferase (GOAT) and energy metabolism.Sci China Life Sci. 2016 Mar;59(3):281-91. doi: 10.1007/s11427-015-4973-6. Epub 2016 Jan 6. Sci China Life Sci. 2016. PMID: 26732975 Review.
Cited by
-
The Role of Ghrelin and Ghrelin Signaling in Aging.Int J Mol Sci. 2017 Jul 12;18(7):1511. doi: 10.3390/ijms18071511. Int J Mol Sci. 2017. PMID: 28704966 Free PMC article. Review.
-
Prebiotic fibres dose-dependently increase satiety hormones and alter Bacteroidetes and Firmicutes in lean and obese JCR:LA-cp rats.Br J Nutr. 2012 Feb;107(4):601-13. doi: 10.1017/S0007114511003163. Epub 2011 Jul 18. Br J Nutr. 2012. PMID: 21767445 Free PMC article.
-
The use of animal models to decipher physiological and neurobiological alterations of anorexia nervosa patients.Front Endocrinol (Lausanne). 2015 May 19;6:68. doi: 10.3389/fendo.2015.00068. eCollection 2015. Front Endocrinol (Lausanne). 2015. PMID: 26042085 Free PMC article. Review.
-
Calorie restriction activates a gastric Notch-FOXO1 pathway to expand ghrelin cells.J Cell Biol. 2024 Oct 7;223(10):e202305093. doi: 10.1083/jcb.202305093. Epub 2024 Jul 3. J Cell Biol. 2024. PMID: 38958606 Free PMC article.
-
Stress-related alterations of acyl and desacyl ghrelin circulating levels: mechanisms and functional implications.Peptides. 2011 Nov;32(11):2208-17. doi: 10.1016/j.peptides.2011.07.002. Epub 2011 Jul 12. Peptides. 2011. PMID: 21782868 Free PMC article. Review.
References
-
- Masoro EJ. Nutrition and aging—a current assessment. J Nutr. 1985;115:842–8. - PubMed
-
- Mattison JA, Lane MA, Roth GS, Ingram DK. Calorie restriction in rhesus monkeys. Exp Gerontol. 2003;38:35–46. - PubMed
-
- Heilbronn LK, Ravussin E. Calorie restriction and aging: review of the literature and implications for studies in humans. Am J Clin Nutr. 2003;78:361–9. - PubMed
Publication types
MeSH terms
Substances
Grants and funding
LinkOut - more resources
Full Text Sources
Molecular Biology Databases
