

Renin, endothelial NO synthase and endothelin gene expression in the 2kidney-1clip Goldblatt model of long-term renovascular hypertension
- PMID: 20149985
- PMCID: PMC3351937
- DOI: 10.1186/2047-783x-14-12-520
Renin, endothelial NO synthase and endothelin gene expression in the 2kidney-1clip Goldblatt model of long-term renovascular hypertension
Abstract
Objective: Numerous reports have shown the influence of renin, nitric oxide (NO) and the endothelin (ET) systems for regulation of blood pressure and renal function. Furthermore, interactions between these peptides have been reported. Aim of our study was to investigate the relative contribution of these compounds in long-term renovascular hypertension / renal ischemia.
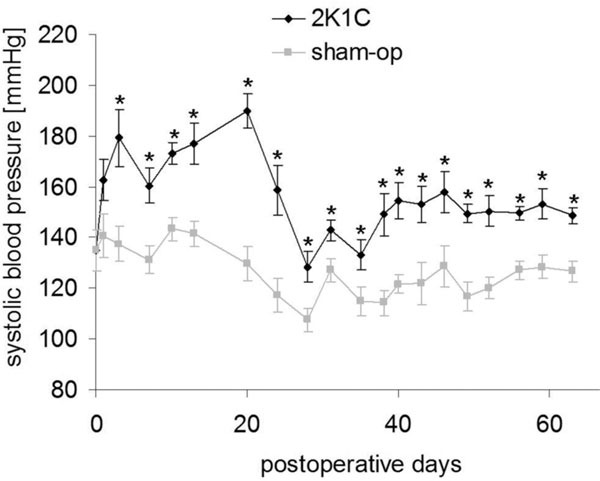
Methods: Hypertension / left-sided renal ischemia was induced using the 2K1C-Goldblatt rat model. Renal renin, ET-1, ET-3 and endothelial NO synthase (eNOS) gene expression was measured by means of RNAse protection assay at different timepoints up to 10 weeks after induction of renal artery stenosis.
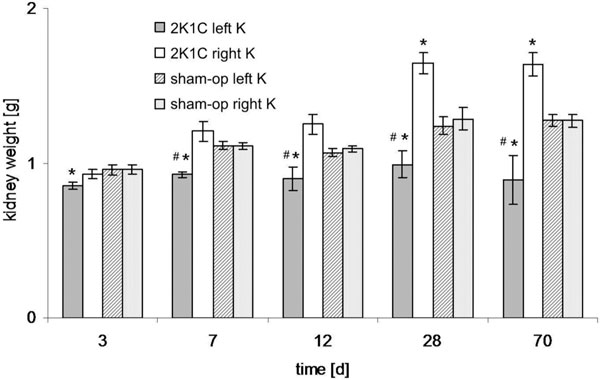
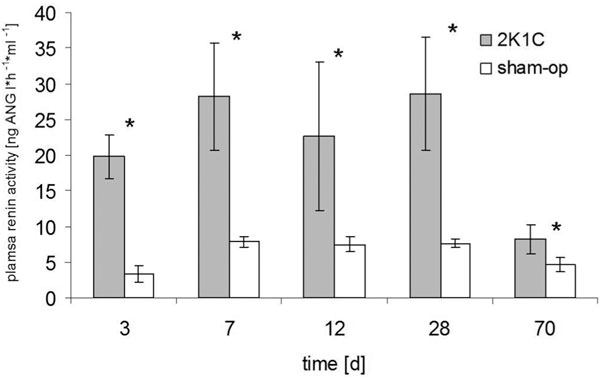
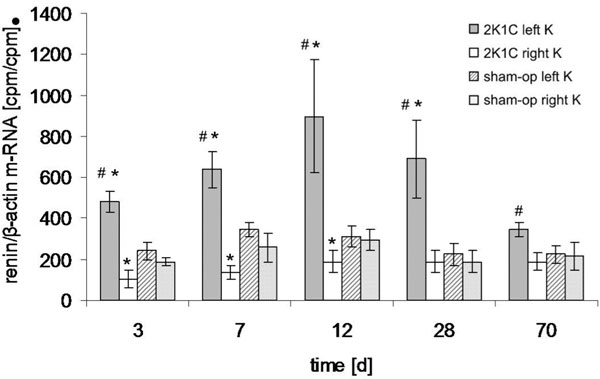
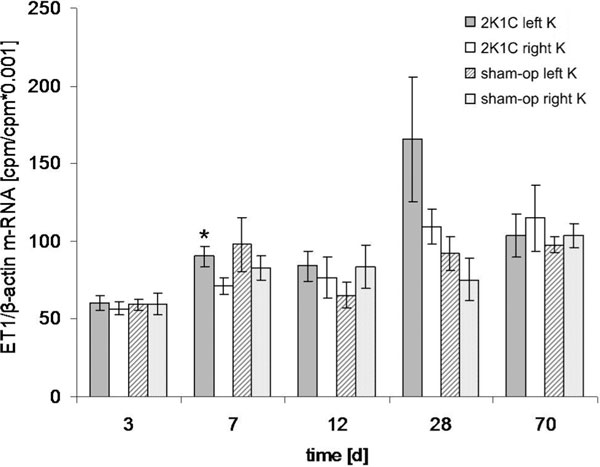
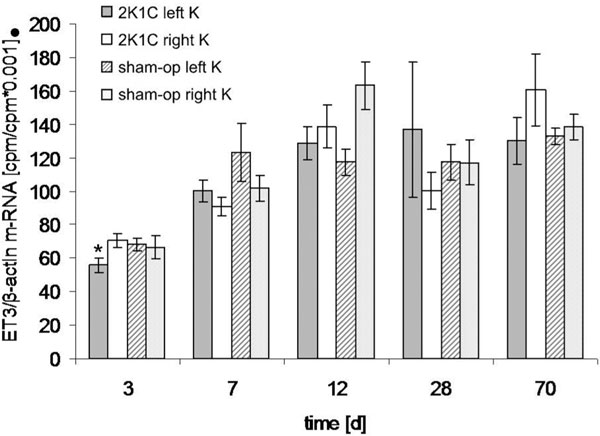
Results: Plasma renin activity and renal renin gene expression in the left kidney were increased in the clipped animals while eNOS expression was unchanged. Furthermore, an increase in ET-1 expression and a decrease of ET-3 expression was detected in early stenosis.
Conclusions: While renin is obviously involved in regulation of blood pressure and renal function in unilateral renal artery stenosis, ET-1, ET-3 and endothelium derived NO do not appear to play an important role in renal adaptation processes in long-term renal artery stenosis, although ET-1 and ET-3 might be involved in short-term adaptation processes.
Figures
Similar articles
-
Endothelin-1 gene expression in blood vessels and kidney of spontaneously hypertensive rats (SHR), L-NAME-treated SHR, and renovascular hypertensive rats.J Cardiovasc Pharmacol. 1998;31 Suppl 1:S380-3. doi: 10.1097/00005344-199800001-00108. J Cardiovasc Pharmacol. 1998. PMID: 9595489
-
Vascular and cardiac overexpression of endothelin-1 gene in one-kidney, one clip Goldblatt hypertensive rats but only in the late phase of two-kidney one clip Goldblatt hypertension.J Hypertens. 1996 Jan;14(1):57-64. J Hypertens. 1996. PMID: 12013496
-
Dietary capsaicin-mediated attenuation of hypertension in a rat model of renovascular hypertension.Clin Exp Hypertens. 2020 May 18;42(4):352-359. doi: 10.1080/10641963.2019.1665676. Epub 2019 Sep 13. Clin Exp Hypertens. 2020. PMID: 31518162
-
Effects of aortic stenosis on renal renin, angiotensin receptor, endothelin and NOS gene expression in rats.Am J Nephrol. 2002 Jan-Feb;22(1):84-9. doi: 10.1159/000046679. Am J Nephrol. 2002. PMID: 11919408
-
The role of extrarenal renin in Goldblatt hypertension.Am J Hypertens. 1991 Oct;4(10 Pt 2):575S-577S. doi: 10.1093/ajh/4.10.575s. Am J Hypertens. 1991. PMID: 1741994 Review.
References
-
- Sigmon DH, Beierwaltes WH. Influence of nitric oxide in the chronic phase of two-kidney, one clip renovascular hypertension. Hypertension. 1998;31:649–56. - PubMed
-
- Turkstra E, Boer P, Braam B, Koomans HA. Increased availability of nitric oxide leads to enhanced nitric oxide dependency of tubuloglomerular feedback in the contralateral kidney of rats with 2-kidney, 1-clip Goldblatt hypertension. Hypertension. 1999;34:679–84. - PubMed
-
- Zollmann FS, Paul M. Transgenic models for the study of endothelin function in the cardiovascular system. J Cardiovasc Pharmacol. 2000;35:S13–6. - PubMed
MeSH terms
Substances
LinkOut - more resources
Full Text Sources
