. 2010 May;59(5):1192-201.
doi: 10.2337/db09-0791. Epub 2010 Feb 11.

Progression of diet-induced diabetes in C57BL6J mice involves functional dissociation of Ca2(+) channels from secretory vesicles

Affiliations

Progression of diet-induced diabetes in C57BL6J mice involves functional dissociation of Ca2(+) channels from secretory vesicles

Stephan C Collins et al. Diabetes. 2010 May.

Abstract

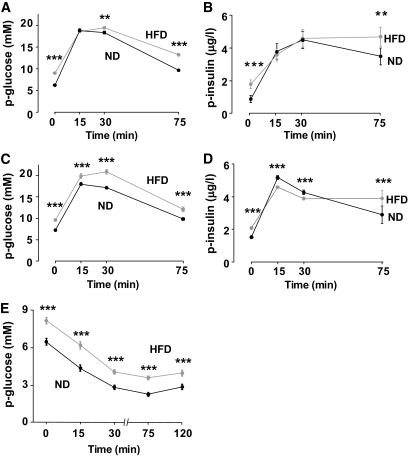
Objective: The aim of the study was to elucidate the cellular mechanism underlying the suppression of glucose-induced insulin secretion in mice fed a high-fat diet (HFD) for 15 weeks.

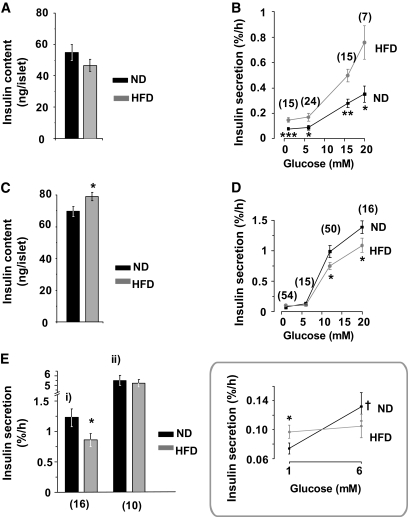
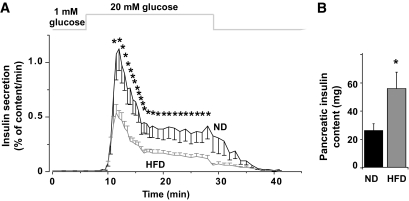
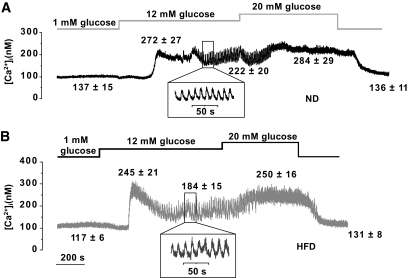
Research design and methods: C57BL6J mice were fed a HFD or a normal diet (ND) for 3 or 15 weeks. Plasma insulin and glucose levels in vivo were assessed by intraperitoneal glucose tolerance test. Insulin secretion in vitro was studied using static incubations and a perfused pancreas preparation. Membrane currents, electrical activity, and exocytosis were examined by patch-clamp technique measurements. Intracellular calcium concentration ([Ca(2+)](i)) was measured by microfluorimetry. Total internal reflection fluorescence microscope (TIRFM) was used for optical imaging of exocytosis and submembrane depolarization-evoked [Ca(2+)](i). The functional data were complemented by analyses of histology and gene transcription.

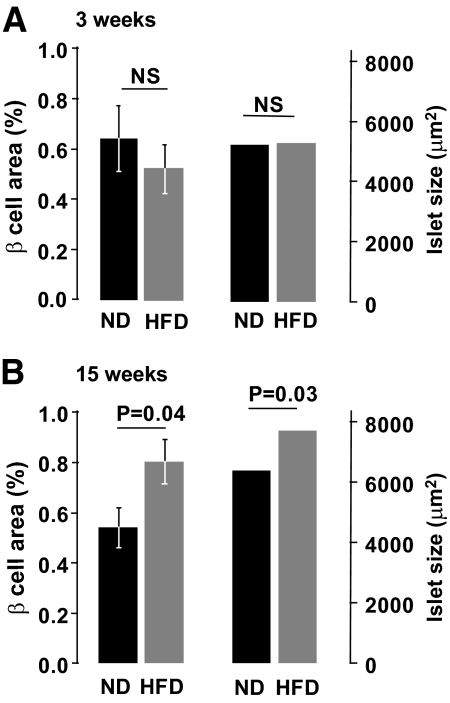
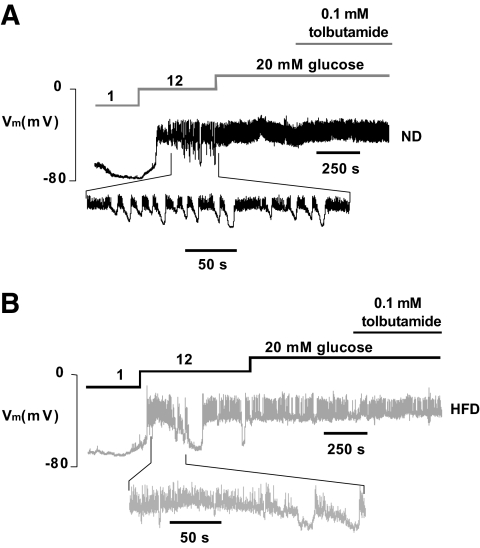
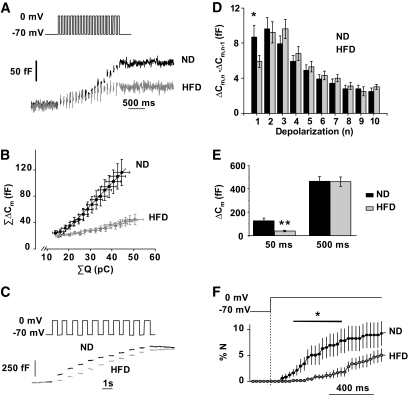
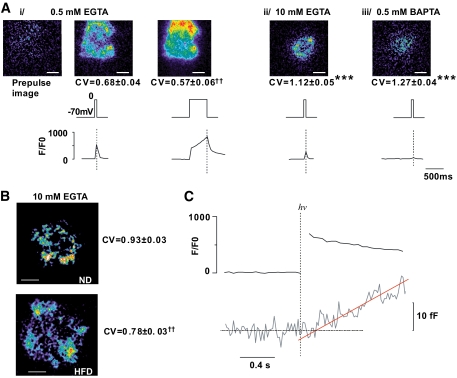
Results: After 15 weeks, but not 3 weeks, mice on HFD exhibited hyperglycemia and hypoinsulinemia. Pancreatic islet content and beta-cell area increased 2- and 1.5-fold, respectively. These changes correlated with a 20-50% reduction of glucose-induced insulin secretion (normalized to insulin content). The latter effect was not associated with impaired electrical activity or [Ca(2+)](i) signaling. Single-cell capacitance and TIRFM measurements of exocytosis revealed a selective suppression (>70%) of exocytosis elicited by short (50 ms) depolarization, whereas the responses to longer depolarizations were (500 ms) less affected. The loss of rapid exocytosis correlated with dispersion of Ca(2+) entry in HFD beta-cells. No changes in gene transcription of key exocytotic protein were observed.

Conclusions: HFD results in reduced insulin secretion by causing the functional dissociation of voltage-gated Ca(2+) entry from exocytosis. These observations suggest a novel explanation to the well-established link between obesity and diabetes.


Figures

FIG. 1.
FIG. 1.
Long-term HFD induces glucose intolerance and insulin resistance. A–D: Plasma (p)-glucose and insulin levels measured in mice fed ND (black traces and symbols) or HFD (gray traces and symbols) for 3 (A and B) and 15 (C and D) weeks during an IPGTT. Data are mean values ± SEM of n = 49 (A), n = 24 (B), n = 33 (C), and n = 14 (D). *P < 0.05, **P < 5 × 10⁻³, ***P < 5 × 10⁻⁴. E: Intraperitoneal insulin tolerance tests performed in 12-week-old mice (n = 23 in each group). The traces show means ± SEM. *P < 0.001 for comparisons between ND and HFD values.
FIG. 2.
FIG. 2.
Effects of HFD on GIIS in vitro. A–E: Insulin content (A and C) and insulin secretion (B, D, and E) in ND (black) and HFD (gray) islets. Data are from mice fed ND or HFD for 3 (A and B) and 15 (C–E) weeks. B and D: The islets were challenged with glucose at the indicated concentrations. Ei: Islets were stimulated by 0.2 mmol/l tolbutamide in the presence of 12 mmol/l glucose. Eii: Islets were stimulated by 70 mmol/l KCl in the presence of 20 mmol/l glucose. D inset: The data highlighted within the box compare insulin secretion at 1 and 6 mmol/l in ND and HFD islets. The number below each point represents the minimum number of cases in that group. At least four different animals were used in each group. Data are mean values ± SEM. *P < 0.05, **P < 0.005, ***P < 0.0005 for differences between ND and HFD. †P < 0.05 indicates difference between 6 and 1 mmol/l glucose. Numbers in parentheses in (B, D, and E) are number of experiments performed.
FIG. 3.
FIG. 3.
HFD reduces first- and second-phase release equally. GIIS in perfused pancreata from control (black) and HFD (gray) mice (A) at 15 weeks. The rates of insulin secretion are given as mean values ± SEM and are normalized to pancreatic insulin content. B: Total pancreatic insulin content in ND (black) and HFD (gray) mice. *P < 0.05 vs. control (n > 15 mice in each group).
FIG. 4.
FIG. 4.
Effects of HFD on [Ca2+]i. Glucose- and tolbutamide-evoked changes in [Ca2+]i in islets from mice fed the ND (A) and HFD (B) for 15 weeks. Representative traces are shown for each group. Values given above the traces are means ± SEM (n > 13 islets from seven mice). *P < 0.05 for comparisons of [Ca2+]i under the respective conditions in ND and HFD islets.
FIG. 5.
FIG. 5.
Effects of HFD on β-Cell area. β-Cell surface area ratio to pancreatic surface area (left) and mean islet size (right) after 3 (A) or 15 (B) weeks on ND and HFD. Up to 24 sections taken from three mice were analyzed for each group. Data are mean values ± SEM. In the case of average islet size, significance levels (indicated above histograms) were calculated on transformed data (logarithm).
FIG. 6.
FIG. 6.
Effects of 15 weeks of HFD on β-Cell electrical activity. A and B: Representative membrane potential (Vm) recordings from β-cells in intact ND (A) and HFD (B) islets (n = 7 islets in both groups, from four different animals). Segments of the records obtained at 12 mmol/l glucose (taken as indicated) are shown on an expanded time base below for both ND and HFD islets.
FIG. 7.
FIG. 7.
A 15-week HFD treatment inhibits depolarization-evoked exocytosis. A: Representative recordings of exocytosis during a train of 50-ms (10 Hz) depolarizations from −70 mV to 0 mV in ND (black) and HFD (gray) β-cells. B: Relationship between integrated current charge (ΣQ) and changes in membrane capacitance (ΣΔCm) during the train of twenty 50-ms depolarizations (10 Hz). The responses during the four first depolarizations (not associated with exocytosis) are not shown. The lines superimposed on the data points indicate the slopes of the relationships. C: Representative increases in cell capacitance evoked by a train of ten 500-ms (1 Hz) depolarizations from −70 mV to 0 mV in ND (black) and HFD (gray) β-cells. D: Increase in cell capacitance for each pulse during the train of 500-ms depolarizations in ND (black) and HFD (gray) β-cells. Mean values ± SEM for 75 (ND) and 61 (HFD) cells. *P < 0.06. E: Total capacitance increments (in fF) following the train of 50-ms (black) and 500-ms (gray) pulses. Data are means ± SEM for at least 61–75 β-cells from six animals from each group in the long pulses experiment and for at least 23 β-cells from three animals from each group in the short pulses experiment. **P < 0.005. F: Average rates of optically measured release of vesicles by discharge of fluorescent IAPP-mCherry cargo during a 1,000-ms membrane depolarization to 0 mV. Data are means ± SEM for 5 and 6 cells from two animals in each group for both ND (black) and HFD (gray) β-cells. *P < 0.05.
FIG. 8.
FIG. 8.
HFD causes dispersion of Ca2+ entry. A: Evanescent-field illumination of voltage-clamped cells infused with 0.5 mmol/l EGTA (i), 10 mmol/l EGTA (ii), or 0.5 mmol/l BAPTA (iii) and Ca2+ Green 6F (10 μmol/l). The images in Ai show the prestimulatory fluorescence and the increase produced by 50- and 500-ms depolarizations, respectively. Numbers below images are CV values for the Ca2+ signal (mean values ± SEM) for 6 (i), 11 (ii), and 11 (iii) different cells. ***P < 5 × 10⁻⁵ (unpaired t test) or ††P < 0.005 (paired t test) for comparisons with CV measured after a 50-ms depolarization with 0.5 mmol/l EGTA. Scale bars: 2 μm. The vertical lines superimposed on the [Ca2+]i traces indicate the end of the depolarization. B: As in Aii but using ND or HFD β-cells (as indicated). CV values for the Ca2+ signal during a 50-ms depolarization to 0 mV for control (n = 12 from three mice) and HFD (n = 15 from three mice) β-cells are shown to the right of each image alongside. ††P < 0.001 for comparison between HFD and ND β-cells. C: Immediate increases in [Ca2+]i and delayed increase in membrane capacitance (ΔCm) in β-cells from C57BL6J mice in response to photoliberation of caged Ca2+ (Ca2+-np-EGTA preloaded into the cell). The trace is the average response recorded in seven cells from three different animals. The continuous red line represents the back-extrapolation toward the baseline (dashed horizontal line). The intersection of the two lines was taken as the delay. (A high-quality digital representation of this figure is available in the online issue.)

Similar articles

Cited by

References

    1. Lillioja S, Mott DM, Spraul M, Ferraro R, Foley JE, Ravussin E, Knowler WC, Bennett PH, Bogardus C. Insulin resistance and insulin secretory dysfunction as precursors of non-insulin-dependent diabetes mellitus: prospective studies of Pima Indians. N Engl J Med 1993;329:1988–1992 - PubMed
    1. Colditz GA, Willett WC, Stampfer MJ, Manson JE, Hennekens CH, Arky RA, Speizer FE. Weight as a risk factor for clinical diabetes in women. Am J Epidemiol 1990;132:501–513 - PubMed
    1. Kashyap S, Belfort R, Gastaldelli A, Pratipanawatr T, Berria R, Pratipanawatr W, Bajaj M, Mandarino L, DeFronzo R, Cusi K. A sustained increase in plasma free fatty acids impairs insulin secretion in nondiabetic subjects genetically predisposed to develop type 2 diabetes. Diabetes 2003;52:2461–2474 - PubMed
    1. Buettner R, Scholmerich J, Bollheimer LC. High-fat diets: modeling the metabolic disorders of human obesity in rodents. Obesity (Silver Spring) 2007;15:798–808 - PubMed
    1. Kaku K, Fiedorek FT, Jr, Province M, Permutt MA. Genetic analysis of glucose tolerance in inbred mouse strains: evidence for polygenic control. Diabetes 1988;37:707–713 - PubMed

Publication types