. 2010 May;59(5):1132-42.
doi: 10.2337/db09-1105. Epub 2010 Feb 11.

Downregulation of adipose glutathione S-transferase A4 leads to increased protein carbonylation, oxidative stress, and mitochondrial dysfunction

Affiliations

Downregulation of adipose glutathione S-transferase A4 leads to increased protein carbonylation, oxidative stress, and mitochondrial dysfunction

Jessica M Curtis et al. Diabetes. 2010 May.

Abstract

Objective: Peripheral insulin resistance is linked to an increase in reactive oxygen species (ROS), leading in part to the production of reactive lipid aldehydes that modify the side chains of protein amino acids in a reaction termed protein carbonylation. The primary enzymatic method for lipid aldehyde detoxification is via glutathione S-transferase A4 (GSTA4) dependent glutathionylation. The objective of this study was to evaluate the expression of GSTA4 and the role(s) of protein carbonylation in adipocyte function.

Research design and methods: GSTA4-silenced 3T3-L1 adipocytes and GSTA4-null mice were evaluated for metabolic processes, mitochondrial function, and reactive oxygen species production. GSTA4 expression in human obesity was evaluated using microarray analysis.

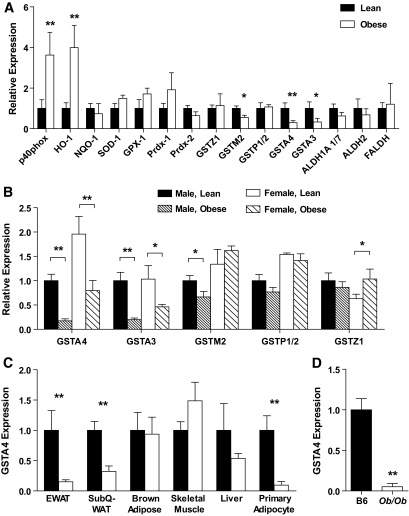
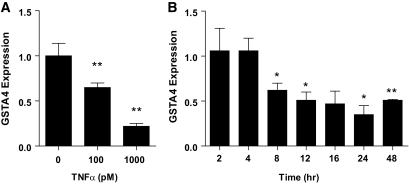
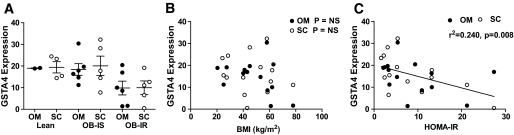
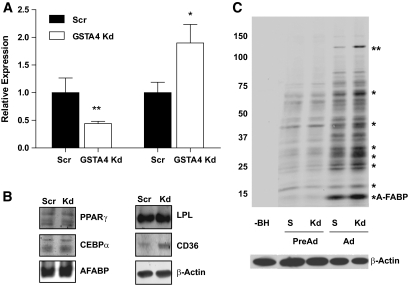
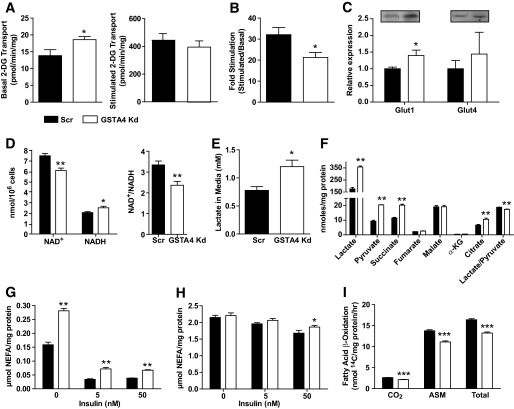
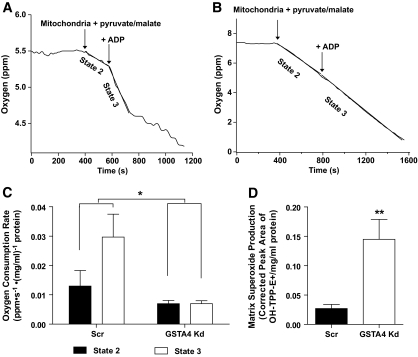
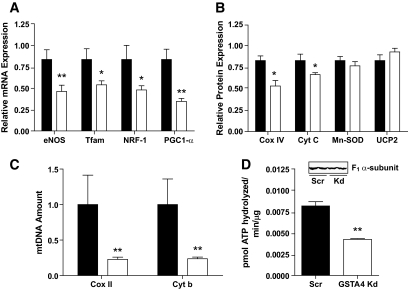
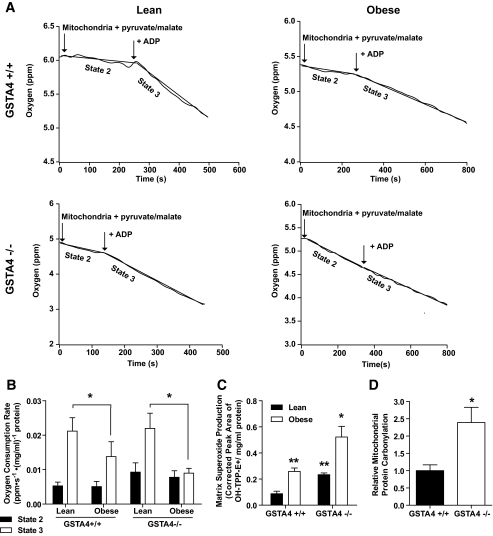
Results: GSTA4 expression is selectively downregulated in adipose tissue of obese insulin-resistant C57BL/6J mice and in human obesity-linked insulin resistance. Tumor necrosis factor-alpha treatment of 3T3-L1 adipocytes decreased GSTA4 expression, and silencing GSTA4 mRNA in cultured adipocytes resulted in increased protein carbonylation, increased mitochondrial ROS, dysfunctional state 3 respiration, and altered glucose transport and lipolysis. Mitochondrial function in adipocytes of lean or obese GSTA4-null mice was significantly compromised compared with wild-type controls and was accompanied by an increase in superoxide anion.

Conclusions: These results indicate that downregulation of GSTA4 in adipose tissue leads to increased protein carbonylation, ROS production, and mitochondrial dysfunction and may contribute to the development of insulin resistance and type 2 diabetes.


Figures

FIG. 1.
FIG. 1.
Expression of oxidative stress–responsive genes in adipose tissue in obesity. C57BL/6J mice were fed either a low-fat or high-fat diet for 9–12 weeks, and mRNA was isolated from the indicated tissue. A: Expression of the indicated genes in epididymal WAT analyzed by qPCR (lean, n = 8; obese, n = 7). NQO-1, NADPH quninone oxidoreductase 1. B: Expression of GST isozymes in WAT of lean and obese male and female mice (male, lean, n = 8; male, obese, n = 7; female, lean, n = 5; female, obese, n = 4). C: Expression of GSTA4 in various tissues or cells from lean and obese male mice (n = 8). D: Expression of GSTA4 in C57BL/6J mice (B6) relative to that in adipose tissue of ob/ob mice. TBP, TATA-box binding protein; TFIIE, transcription factor II E. *P < 0.05; **P < 0.01.
FIG. 2.
FIG. 2.
Effect of TNF-α treatment on GSTA4 expression in 3T3–L1 adipocytes. qPCR analysis of GSTA4 mRNA expression in day-8 3T3–L1 adipocytes normalized to TFIIE as a function of (A) TNF-α level after 24 h or (B) time of treatment with 1 nmol/l TNF-α. *P < 0.05; **P < 0.01 relative to control samples.
FIG. 3.
FIG. 3.
Expression of human GSTA4 in obesity and insulin resistance. A: Relative expression of GSTA4 in omental and subcutaneous white adipose tissues of patients characterized as lean insulin sensitive (Lean), obese insulin sensitive (OB-IS), or obese insulin resistant (OB-IR). Data are expressed using means ± SEM. B: Correlation of GSTA4 mRNA expression in omental or subcutaneous adipose with patient BMI in kg/m2. C: Correlation of GSTA4 mRNA expression in omental or subcutaneous adipose with HOMA-IR, calculated as [insulin (μU/ml) × glucose (mmol/l)]/22.5. Each data point represents one individual.
FIG. 4.
FIG. 4.
GSTA4 silencing and protein carbonylation in 3T3–L1 adipocytes. A: Relative levels of GSTA4 and GSTA3 mRNA were quantified by qPCR (n = 6 per group). GSTA4 expression was normalized to TFIIE, and GSTA3 expression was normalized to 36B4. B: Expression of adipogenic marker proteins (n = 6 per group). C: Protein carbonylation in GSTA4 knockdown and Scr control cells. Protein bands found to have increased carbonylation in the GSTA4 knockdown adipocytes are indicated (*). The ∼145-kDa band (**) was digested and subjected to liquid chromatography–electrospray ionization tandem mass spectrometry for protein identification detailed in supplementary Table 2. S, scrambled, −BH, minus biotin hydrazide. C: A composite in which the −BH lane has been moved from the same digital image (at the same exposure) to be adjacent to the experimental lanes.
FIG. 5.
FIG. 5.
Glucose and lipid metabolism in GSTA4 knockdown and Scr adipocytes. A: Transport of 2-deoxyglucose (2-DG) in GSTA4 knockdown and Scr adipocytes under basal (left) and 100 nmol/l insulin-stimulated (right) conditions. B: Fold stimulation of hexose transport in GSTA4 knockdown and Scr 3T3–L1 adipocytes (n = 9). C: Expression of glucose transporters GLUT1 and GLUT4 (n = 6 per group). D: NAD+, NADH, and NAD+/NADH in day 7 GSTA4 knockdown and Scr adipocytes (n = 6). E: L(+)-lactate in the medium of GSTA4 knockdown and Scr cells (n = 6). F: Organic acids from GSTA4 knockdown and Scr adipocyte cell lysates. Basal (G) and forskolin-stimulated (H) lipolysis in Scr and GSTA4 knockdown 3T3–L1 adipocytes. I: β-oxidation of [14C]-palmitate in Scr and knockdown adipocytes (n = 6). G and H: Analyzed by two-way ANOVA with Bonferroni post hoc analysis. *P < 0.05; **P < 0.01.
FIG. 6.
FIG. 6.
Mitochondria function in GSTA4 knockdown and Scr 3T3–L1 adipocytes. Mitochondrial oxygen consumption in Scr (A) or GSTA4 knockdown (B) adipocytes. C: Oxygen consumption rates for Scr and GSTA4 knockdown adipocytes (n = 3). Statistics calculated by two-way analysis with Bonferroni post hoc analysis. D: Mitochondrial matrix superoxide production in GSTA4 knockdown and Scr adipocytes (n = 3).
FIG. 7.
FIG. 7.
Expression of genes and proteins linked to mitochondrial biogenesis. A: Expression of transcription factors and target mRNA in GSTA4-silenced (open bars) and scrambled (closed bars) adipocytes (n = 6). B: Mitochondrial protein expression in GSTA4 knockdown and Scr adipocytes (n = 3–6). C: Expression of COX II and cytochrome b DNA relative to UCP2 DNA in GSTA4 knockdown and Scr adipocytes (n = 6). D: Activity of ATP synthase in GSTA4-silenced and scrambled adipocytes and level of ATP synthase α-subunit protein (n = 3). *P < 0.05; **P < 0.01.
FIG. 8.
FIG. 8.
Mitochondrial function and expression in adipose tissue from C57BL/6J and GSTA4-null (−/−) mice. Mitochondria were isolated from EWAT of 4- to 5-month-old mice maintained on a standard chow (lean) or high-fat (obese) diets. A: Mitochondrial oxygen consumption in lean and obese wild-type (+/+) and GSTA4-null (−/−) adipose. The mitochondrial protein concentrations were 0.22 (lean +/+), 0.23 (obese +/+), 0.20 (lean −/−), and 0.23 (obese −/−) mg/ml. B: Oxygen consumption rates for all four groups (n = 3). Statistics calculated using two-way ANOVA for each state with Holm-Sidak post hoc analysis. Variation due to loss of GSTA4 in state 2: P = 0.1; variation due to obesity in state 3: P = 0.03. C: Mitochondrial matrix superoxide production (n = 3). Statistics calculated using two-way ANOVA with Bonferroni post hoc analysis. Effect of obesity: P = 0.0009; effect of GSTA4: P = 0.0018. D: Quantitation of mitochondrial protein carbonylation in EWAT from lean wild-type and GSTA4-null mice (n = 6). *P < 0.05, **P < 0.01, ***P < 0.001.

Similar articles

Cited by

References

    1. Ogden CL, Carroll MD, Curtin LR, McDowell MA, Tabak CJ, Flegal KM. Prevalence of overweight and obesity in the United States, 1999–2004. JAMA 2006;295:1549–1555 - PubMed
    1. Furukawa S, Fujita T, Shimabukuro M, Iwaki M, Yamada Y, Nakajima Y, Nakayama O, Makishima M, Matsuda M, Shimomura I. Increased oxidative stress in obesity and its impact on metabolic syndrome. J Clin Invest 2004;114:1752–1761 - PMC - PubMed
    1. Talior I, Yarkoni M, Bashan N, Eldar-Finkelman H. Increased glucose uptake promotes oxidative stress and PKC-delta activation in adipocytes of obese, insulin-resistant mice. Am J Physiol Endocrinol Metab 2003;285:E295–E302 - PubMed
    1. Anderson EJ, Lustig ME, Boyle KE, Woodlief TL, Kane DA, Lin CT, Price JW, III, Kang L, Rabinovitch PS, Szeto HH, Houmard JA, Cortright RN, Wasserman DH, Neufer PD. Mitochondrial H2O2 emission and cellular redox state link excess fat intake to insulin resistance in both rodents and humans. J Clin Invest 2009February2 pii: 37048 doi: 10.1172/JCI37048. [Epub ahead of print] - DOI - PMC - PubMed
    1. Houstis N, Rosen ED, Lander ES. Reactive oxygen species have a causal role in multiple forms of insulin resistance. Nature 2006;440:944–948 - PubMed

Publication types

MeSH terms

Substances