Full-length adiponectin attenuates insulin signaling and inhibits insulin-stimulated amino Acid transport in human primary trophoblast cells
- PMID: 20150288
- PMCID: PMC2857896
- DOI: 10.2337/db09-0824
Full-length adiponectin attenuates insulin signaling and inhibits insulin-stimulated amino Acid transport in human primary trophoblast cells
Abstract
Objective: Maternal adiponectin levels are reduced and placental nutrient transporters are upregulated in obesity and gestational diabetes mellitus; however, the effects of adiponectin on placental function are unknown. We hypothesized that adiponectin regulates placental amino acid transport.
Research design and methods: Human primary trophoblast cells were cultured and incubated with globular adiponectin (gAd) or full-length adiponectin (fAd) alone or in combination with insulin. System A and L amino acid transport and SNAT1, SNAT2, and SNAT4 isoform expression was measured. The activity of the AMP-activated protein kinase (AMPK), phosphatidylinositol 3 kinase-AKT, and peroxisome proliferator-activated receptor-alpha (PPARalpha) signaling pathways was determined.
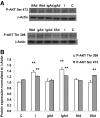
Results: In the absence of insulin, gAd stimulated AMPK Thr172 phosphorylation, SNAT2 protein expression, and system A activity. This effect appeared to be mediated by interleukin-6 release and signal transducer and activator of transcription 3 (STAT3) signaling because gAd failed to stimulate system A in cells in which STAT3 had been silenced using small interfering RNA. fAd alone had no effect on system A activity or SNAT expression. Insulin increased AKT and insulin receptor substrate 1 (IRS-1) phosphorylation, system A activity, and SNAT2 expression. When combined with insulin, gAd did not affect system A activity or SNAT expression. In contrast, fAd abolished insulin-stimulated AKT Thr308 and IRS-1 Tyr612 phosphorylation, system A activity, and SNAT2 expression. Furthermore, fAd increased PPARalpha expression and PPARalpha (Ser21) phosphorylation.
Conclusions: In contrast to the insulin-sensitizing actions of adiponectin in liver and muscle reported in the literature, fAd attenuates insulin signaling in primary human trophoblast cells. As a result, fAd inhibits insulin-stimulated amino acid transport, which may have important implications for placental nutrient transport and fetal growth in pregnancy complications associated with altered maternal adiponectin levels.
Figures


Similar articles
-
Adiponectin inhibits insulin function in primary trophoblasts by PPARα-mediated ceramide synthesis.Mol Endocrinol. 2014 Apr;28(4):512-24. doi: 10.1210/me.2013-1401. Epub 2014 Feb 25. Mol Endocrinol. 2014. PMID: 24606127 Free PMC article.
-
Lipopolysaccharide and double stranded viral RNA mediate insulin resistance and increase system a amino acid transport in human trophoblast cells in vitro.Placenta. 2017 Mar;51:18-27. doi: 10.1016/j.placenta.2017.01.124. Epub 2017 Jan 21. Placenta. 2017. PMID: 28292465
-
Interleukin-1β inhibits insulin signaling and prevents insulin-stimulated system A amino acid transport in primary human trophoblasts.Mol Cell Endocrinol. 2013 Dec 5;381(1-2):46-55. doi: 10.1016/j.mce.2013.07.013. Epub 2013 Jul 25. Mol Cell Endocrinol. 2013. PMID: 23891856 Free PMC article.
-
Review: Adiponectin--the missing link between maternal adiposity, placental transport and fetal growth?Placenta. 2013 Mar;34 Suppl:S40-5. doi: 10.1016/j.placenta.2012.11.024. Epub 2012 Dec 13. Placenta. 2013. PMID: 23245987 Free PMC article. Review.
-
Insulin resistance and improvements in signal transduction.Endocrine. 2006 Feb;29(1):73-80. doi: 10.1385/ENDO:29:1:73. Endocrine. 2006. PMID: 16622294 Review.
Cited by
-
Regulation of nutrient transport across the placenta.J Pregnancy. 2012;2012:179827. doi: 10.1155/2012/179827. Epub 2012 Dec 10. J Pregnancy. 2012. PMID: 23304511 Free PMC article. Review.
-
The Antiviral Potential of AdipoRon, an Adiponectin Receptor Agonist, Reveals the Ability of Zika Virus to Deregulate Adiponectin Receptor Expression.Viruses. 2023 Dec 22;16(1):24. doi: 10.3390/v16010024. Viruses. 2023. PMID: 38257725 Free PMC article.
-
Impact of gestational diabetes mellitus in the maternal-to-fetal transport of nutrients.Curr Diab Rep. 2015 Feb;15(2):569. doi: 10.1007/s11892-014-0569-y. Curr Diab Rep. 2015. PMID: 25620402 Review.
-
Kinin B1 receptor controls maternal adiponectin levels and influences offspring weight gain.iScience. 2023 Nov 7;26(12):108409. doi: 10.1016/j.isci.2023.108409. eCollection 2023 Dec 15. iScience. 2023. PMID: 38058311 Free PMC article.
-
Nutrient sensor signaling pathways and cellular stress in fetal growth restriction.J Mol Endocrinol. 2019 Feb 1;62(2):R155-R165. doi: 10.1530/JME-18-0059. J Mol Endocrinol. 2019. PMID: 30400060 Free PMC article. Review.
References
-
- Catalano PM. Increasing maternal obesity and weight gain during pregnancy: the obstetric problems of plentitude. Obstet Gynecol 2007;110:743–744 - PubMed
-
- Lam MH, Wong GY, Lao TT. Reappraisal of neonatal clavicular fracture: relationship between infant size and risk factors. J Reprod Med 2002;47:903–908 - PubMed
-
- Boney CM, Verma A, Tucker R, Vohr BR. Metabolic syndrome in childhood: association with birth weight, maternal obesity, and gestational diabetes mellitus. Pediatrics 2005;115:e290–e296 - PubMed
-
- Jansson T, Ekstrand Y, Björn C, Wennergren M, Powell TL. Alterations in the activity of placental amino acid transporters in pregnancies complicated by diabetes. Diabetes 2002;51:2214–2219 - PubMed
-
- Jansson T, Wennergren M, Powell TL. Placental glucose transport and GLUT 1 expression in insulin-dependent diabetes. Am J Obstet Gynecol 1999;180:163–168 - PubMed
Publication types
MeSH terms
Substances
Grants and funding
LinkOut - more resources
Full Text Sources
Medical
Molecular Biology Databases
Research Materials
Miscellaneous

