

Apparent diffusion coefficient of glial neoplasms: correlation with fluorodeoxyglucose-positron-emission tomography and gadolinium-enhanced MR imaging
- PMID: 20150307
- PMCID: PMC7963953
- DOI: 10.3174/ajnr.A1989
Apparent diffusion coefficient of glial neoplasms: correlation with fluorodeoxyglucose-positron-emission tomography and gadolinium-enhanced MR imaging
Abstract
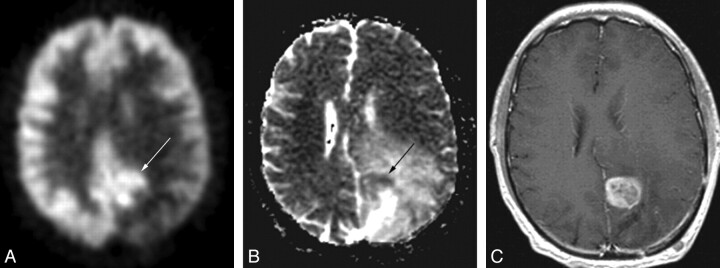
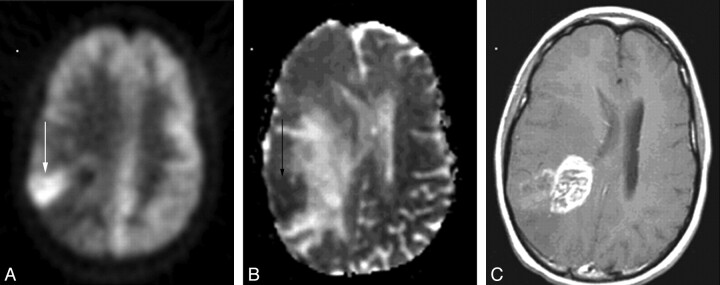
Background and purpose: Gd-enhancement provides essential information in the assessment of brain tumors. However, enhancement does not always correlate with histology or disease activity, especially in the setting of current therapies. Our aim was to compare FDG-PET scans to ADC maps and Gd-enhanced MR images in patients with glial neoplasms to assess whether DWI might offer information not available on routine MR imaging sequences and whether such findings have prognostic significance.
Materials and methods: Institutional review board approval was obtained for this retrospective review, which was conducted in full compliance with HIPAA regulations. Twenty-one patients (11 men and 10 women) with glial tumors underwent FDG-PET and MR imaging, including ADC and Gd- enhancement. Subjectively, regions of interest were drawn around the following areas: 1) increased FDG uptake, 2) decreased signal intensity on ADC maps, and 3) Gd-enhancement. Objectively, FDG-PET and MR images were co-registered, and pixel-by-pixel comparison of ADC to PET values was made for all regions of interest. Correlation coefficients (r values) were calculated for each region of interest. Percentage overlap between regions of interest was calculated for each case.
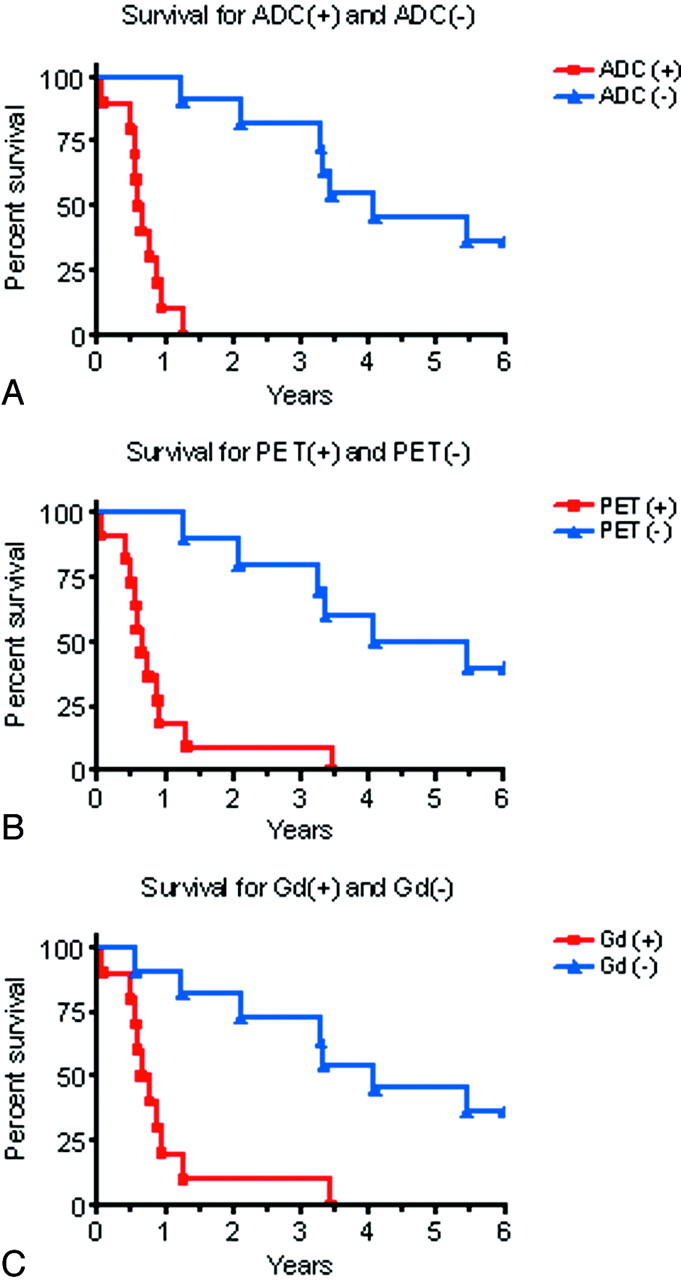
Results: Subjective evaluation showed 60% of patients with excellent or good correlation between ADC maps and FDG-PET. Pixel-by-pixel comparison demonstrated r values that ranged from -0.72 to -0.21. There was significantly greater overlap between decreased ADC and increased FDG-PET uptake (67.1 +/- 15.5%) versus overlap between Gd-enhancement and increased FDG-PET uptake (54.4 +/- 27.5%) (P < .05). ADC overlap was greater with increased FDG-PET than with Gd-enhancement in 8/9 cases. Survival data revealed that the presence of restricted diffusion on ADC correlated with patient survival (P < .0001).
Conclusions: ADC maps in patients with brain tumors provide unique information that is analogous to FDG-PET. There is a greater overlap between ADC and FDG-PET compared with Gd-enhancement. ADC maps can serve to approximate tumor grade and predict survival.
Figures
References
-
- Burger PC, Vogel FS. The brain: tumors. In: Burger PC, Vogel FS. eds. Surgical Pathology of the Central Nervous System and Its Coverings. New York: Wiley; 1982:223–66
-
- DeAngelis L. Brain tumors. N Engl J Med 2003;344:114–23 - PubMed
-
- Hesselager G, Holland EC. Using mice to decipher the molecular genetics of brain tumors. Neurosurgery 2003;53:685–94 - PubMed
-
- Dai C, Holland EC. Astrocyte differentiation states and glioma formation. Cancer J 2003;9:72–81 - PubMed
-
- Fomchenko EI, Holland EC. Mouse models of brain tumors and their applications in preclinical trials. Clin Cancer Res 2006;12:5288–97 - PubMed
MeSH terms
Substances
Grants and funding
LinkOut - more resources
Full Text Sources
Medical