Nuclear factor IA is expressed in astrocytomas and is associated with improved survival
- PMID: 20150379
- PMCID: PMC2940580
- DOI: 10.1093/neuonc/nop044
Nuclear factor IA is expressed in astrocytomas and is associated with improved survival
Abstract
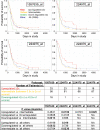
Nuclear factor IA (NFIA) is a transcription factor that specifies glial cell identity and promotes astrocyte differentiation during embryonic development. Its expression and function in gliomas are not known. Here, we examined NFIA protein expression in gliomas and its association with clinical outcome in pediatric malignant astrocytomas. We analyzed expression of NFIA by immunohistochemistry in 88 existing glioma specimens from Childrens Hospital Los Angeles and the University of Southern California. Association between NFIA expression and progression-free survival (PFS) was examined in high-grade astrocytomas for which clinical data were available (n = 23, all children). NFIA was highly expressed in astrocytomas of all grades, but only in a minority of cells in oligodendroglial tumors. NFIA was expressed on a higher percentage of tumor cells in low-grade astrocytomas (91 +/- 5% and 77 +/- 14% in World Health Organization [WHO] I and II, respectively) compared with high-grade astrocytomas (48 +/- 18% and 37 +/- 16% in WHO III and IV, respectively; P < .001, low- vs high-grade astrocytomas). There was a significant association between NFIA expression and PFS in children with astrocytoma WHO grade III or IV (Cox regression P = .019; logrank trend test for NFIA tertiles P = .0040 and NFIA quartiles P = .014). The association was not consistently significant in this small series of patients after adjustment was made for WHO grade III or IV. This is the first study to demonstrate expression of NFIA protein in astrocytomas and its association with grades of astrocytoma and PFS, suggesting that NFIA may play a role in astrocytoma biology.
Figures


Similar articles
-
Transcription factors NFIA and NFIB induce cellular differentiation in high-grade astrocytoma.J Neurooncol. 2020 Jan;146(1):41-53. doi: 10.1007/s11060-019-03352-3. Epub 2019 Nov 23. J Neurooncol. 2020. PMID: 31760595
-
The role of FilGAP, a Rac-specific Rho-GTPase-activating protein, in tumor progression and behavior of astrocytomas.Cancer Med. 2016 Dec;5(12):3412-3425. doi: 10.1002/cam4.937. Epub 2016 Oct 27. Cancer Med. 2016. PMID: 27790861 Free PMC article.
-
SOX4 is overexpressed in diffusely infiltrating astrocytoma and confers poor prognosis.Neuropathology. 2015 Dec;35(6):510-7. doi: 10.1111/neup.12212. Epub 2015 Jun 12. Neuropathology. 2015. PMID: 26096696
-
Signaling in malignant astrocytomas: role of neural stem cells and its therapeutic implications.Clin Cancer Res. 2009 Dec 1;15(23):7124-9. doi: 10.1158/1078-0432.CCR-09-0433. Epub 2009 Nov 24. Clin Cancer Res. 2009. PMID: 19934302 Free PMC article. Review.
-
Phenotypic Spectrum of NFIA Haploinsufficiency: Two Additional Cases and Review of the Literature.Genes (Basel). 2022 Nov 30;13(12):2249. doi: 10.3390/genes13122249. Genes (Basel). 2022. PMID: 36553517 Free PMC article. Review.
Cited by
-
Nuclear factor IX promotes glioblastoma development through transcriptional activation of Ezrin.Oncogenesis. 2020 Apr 14;9(4):39. doi: 10.1038/s41389-020-0223-2. Oncogenesis. 2020. PMID: 32291386 Free PMC article.
-
Hypomethylation of the hsa-miR-191 locus causes high expression of hsa-mir-191 and promotes the epithelial-to-mesenchymal transition in hepatocellular carcinoma.Neoplasia. 2011 Sep;13(9):841-53. doi: 10.1593/neo.11698. Neoplasia. 2011. PMID: 21969817 Free PMC article.
-
The Role of Neurodevelopmental Pathways in Brain Tumors.Front Cell Dev Biol. 2021 Apr 27;9:659055. doi: 10.3389/fcell.2021.659055. eCollection 2021. Front Cell Dev Biol. 2021. PMID: 34012965 Free PMC article. Review.
-
Regulatory Roles of Related Long Non-coding RNAs in the Process of Atherosclerosis.Front Physiol. 2020 Oct 19;11:564604. doi: 10.3389/fphys.2020.564604. eCollection 2020. Front Physiol. 2020. PMID: 33192561 Free PMC article. Review.
-
Nuclear factor one B (NFIB) encodes a subtype-specific tumour suppressor in glioblastoma.Oncotarget. 2016 May 17;7(20):29306-20. doi: 10.18632/oncotarget.8720. Oncotarget. 2016. PMID: 27083054 Free PMC article.
References
-
- CBTRUS. Central Brain Tumor Registry of the United States. 2007–2008
-
- Hegi ME, Diserens AC, Gorlia T, et al. MGMT gene silencing and benefit from temozolomide in glioblastoma. N Engl J Med. 2005;352(10):997–1003. - PubMed
-
- Keles GE, Chang EF, Lamborn KR, et al. Volumetric extent of resection and residual contrast enhancement on initial surgery as predictors of outcome in adult patients with hemispheric anaplastic astrocytoma. J Neurosurg. 2006;105(1):34–40. - PubMed
-
- Sanai N, Berger MS. Glioma extent of resection and its impact on patient outcome. Neurosurgery. 2008;62(4):753–764. discussion 264–266. - PubMed
-
- Sposto R, Ertel IJ, Jenkin RD, et al. The effectiveness of chemotherapy for treatment of high grade astrocytoma in children: results of a randomized trial. A report from the Childrens Cancer Study Group. J Neurooncol. 1989;7(2):165–177. - PubMed
Publication types
MeSH terms
Substances
Grants and funding
LinkOut - more resources
Full Text Sources
Other Literature Sources
Medical

