. 2010 Feb;12(2):133-44.
doi: 10.1093/neuonc/nop043. Epub 2010 Jan 25.

Hyperpolarized 13C magnetic resonance metabolic imaging: application to brain tumors

Affiliations

Hyperpolarized 13C magnetic resonance metabolic imaging: application to brain tumors

Ilwoo Park et al. Neuro Oncol. 2010 Feb.

Abstract

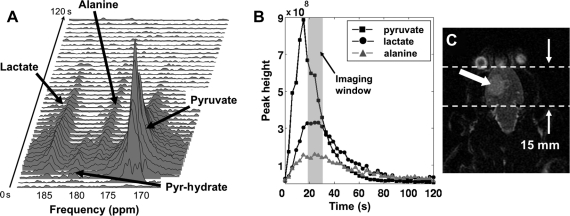
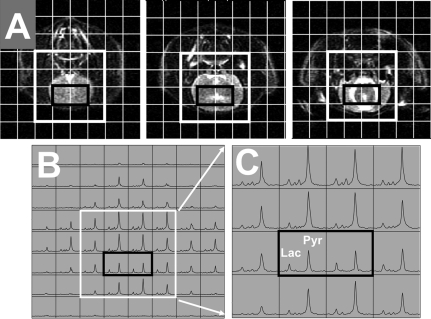
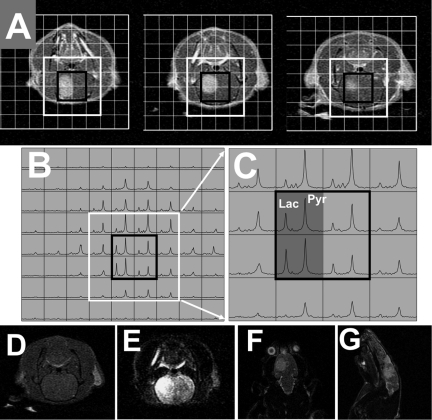
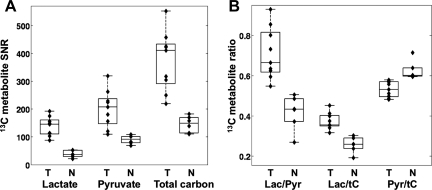
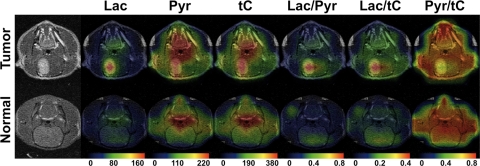
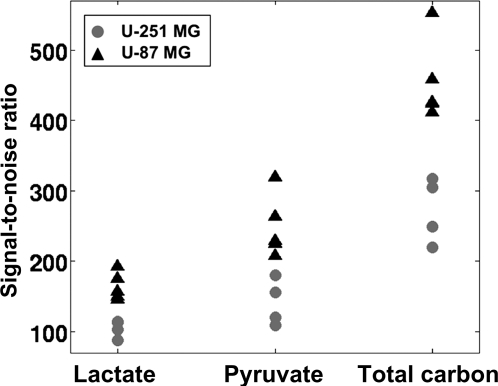
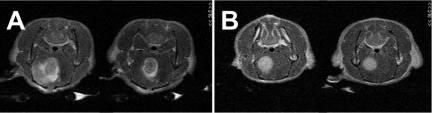
In order to compare in vivo metabolism between malignant gliomas and normal brain, (13)C magnetic resonance (MR) spectroscopic imaging data were acquired from rats with human glioblastoma xenografts (U-251 MG and U-87 MG) and normal rats, following injection of hyperpolarized [1-(13)C]-pyruvate. The median signal-to-noise ratio (SNR) of lactate, pyruvate, and total observed carbon-13 resonances, as well as their relative ratios, were calculated from voxels containing Gadolinium-enhanced tissue in T(1) postcontrast images for rats with tumors and from normal brain tissue for control rats. [1-(13)C]-labeled pyruvate and its metabolic product, [1-(13)C]-lactate, demonstrated significantly higher SNR in the tumor compared with normal brain tissue. Statistical tests showed significant differences in all parameters (P < .0004) between the malignant glioma tissue and normal brain. The SNR of lactate, pyruvate, and total carbon was observed to be different between the U-251 MG and U-87 MG models, which is consistent with inherent differences in the molecular characteristics of these tumors. These results suggest that hyperpolarized MR metabolic imaging may be valuable for assessing prognosis and monitoring response to therapy for patients with brain tumors.


Figures

Fig. 1.
Fig. 1.
A representative example of hyperpolarized 13C dynamic data from a rat with tumor (Tumor 6). The stack plot of 13C magnitude spectra (A) and the peak height plots (B) show the time course of the hyperpolarized [1-13C]-pyruvate and its metabolic products after the injection of 2.3 mL hyperpolarized pyruvate. Forty 13C spectra were plotted in the stack plot (A), and the peak heights of pyruvate, lactate, and alanine are plotted for 120 seconds after the injection (B). The pyruvate peak was scaled down by a factor of 2 for viewing purposes in (B). Both data show the hyperpolarized pyruvate quickly reaching its maximum approximately 15 seconds after the injection and its conversion to lactate and alanine. (A) T2 FSE image in the coronal plane (C) shows the hyperintense region inside the brain (arrow), which depicts the extent of tumor. The dashed line indicates the 15 mm slice thickness used for acquiring the 13C dynamic data.
Fig. 2.
Fig. 2.
Representative hyperpolarized 13C 2D MRSI data from a normal rat (Normal 4). The spectral arrays were overlaid on top of axial T2 FSE images at different locations within the 13C MRSI slice (A). The corresponding magnitude spectra (B) and the zoomed-in spectra around the rat brain (C) showed hyperpolarized [1-13C]-pyruvate and its conversion to other metabolites. The normal brain tissues (voxels inside the black box) displayed ample SNR of lactate and pyruvate. The pyruvate signal inside the brain was low compared with that in the other regions outside the brain, presumably due to the intact BBB.
Fig. 3.
Fig. 3.
Representative anatomical images and the corresponding magnitude spectra from a hyperpolarized 13C 2D MRSI study of a rat with tumor (Tumor 6). Axial T1 post-Gd images within the MRSI slice show contrast-enhancing lesion inside the brain (A). These 1.2 mm thick axial images represent a fraction of volume that contributed to the 13C signal acquired from a 10 mm slice. The white and black boxes represent the voxels around the brain and inside the brain, respectively. The corresponding magnitude spectra (B) and the zoomed-in spectra around the brain (C) clearly showed elevated 13C lactate and pyruvate levels in the tumor (highlighted voxels in the black box in C) compared with the brain tissue in the contra-lateral hemisphere and, most importantly, the brain tissue from the normal rats (Fig. 2C). An axial T1 pre-Gd image (D) and T2 FSE images in axial, coronal, and sagittal planes (E–G) are also shown.
Fig. 4.
Fig. 4.
Comparison of the SNR of lactate, pyruvate, and total carbon (A) and the ratio of Lac/Pyr, Lac/tC, and Pyr/tC (B) between the tumor (T) and normal (N) rats. All 13C parameters showed significant differences and clear separation between 2 groups (P < .0004).
Fig. 5.
Fig. 5.
Metabolic maps of 13C imaging parameters between a rat with tumor and a control rat. All 6 parameters exhibited considerably different intensity between the contrast-enhanced brain tissue of the rat with tumor and the brain tissue of the control rat. Lac, lactate SNR; Pyr, pyruvate SNR; tC, total carbon SNR; Lac/Pyr, lactate over pyruvate ratio; Lac/tC, lactate over total carbon ratio; Pyr/tC, pyruvate over total carbon ratio.
Fig. 6.
Fig. 6.
Comparison of the SNR of lactate, pyruvate, and total carbon between U-251 MG and U-87 MG xenograft. All 3 parameters were significantly different between the 2 tumor types (P < .02).
Fig. 7.
Fig. 7.
Staining of U-251 MG (A–C) and U-87 MG (D–F) xenograft with MIB-1 (A, D), CA-9 (B, E), and H&E (C, F). In the U-251 MG tissue, the zones of cellular hypoxia (arrow in B) corresponded to the zones of lower MIB-1 labeling (arrow in A). In contrast to U-251 MG, the U-87 MG xenografts did not exhibit zonal hypoxia or MIB-1 labeling, and there were no large zones of geographic necrosis. All images are at the same magnification.
Fig. 8.
Fig. 8.
Correlation between proliferation marker (MIB-1) and the SNR of lactate. Both U-251 MG and U-87 MG tumors showed a strong correlation with MIB-1 index (r = 0.08).
Fig. 9.
Fig. 9.
The patterns of contrast enhancement in T1 post-Gd images between rats with U-251 MG model (A) and U-87 MG model (B). The U-251 MG tumor displayed heterogeneous levels of contrast enhancement, whereas the levels of contrast enhancement of the U-87 tumor were relatively constant, with well-demarcated tumor margin. The difference in contrast-enhancing patterns may be indicative of inherent differences in molecular characteristics between these 2 tumor models.

References

    1. Warburg O. On the origin of cancer cells. Science. 1956;123(3191):309–314. - PubMed
    1. Kaibara T, Tyson RL, Sutherland GR. Human cerebral neoplasms studied using MR spectroscopy: a review. Biochem Cell Biol. 1998;76(2–3):477–486. - PubMed
    1. Herholz K, Heindel W, Luyten PR, et al. In vivo imaging of glucose consumption and lactate concentration in human gliomas. Ann Neurol. 1992;31(3):319–327. - PubMed
    1. Terpstra M, Gruetter R, High WB, et al. Lactate turnover in rat glioma measured by in vivo nuclear magnetic resonance spectroscopy. Cancer Res. 1998;58(22):5083–5088. - PubMed
    1. Ziegler A, von Kienlin M, Decorps M, Remy C. High glycolytic activity in rat glioma demonstrated in vivo by correlation peak 1H magnetic resonance imaging. Cancer Res. 2001;61(14):5595–5600. - PubMed

Publication types