

Free oligosaccharides to monitor glycoprotein endoplasmic reticulum-associated degradation in Saccharomyces cerevisiae
- PMID: 20150426
- PMCID: PMC2852977
- DOI: 10.1074/jbc.M109.082081
Free oligosaccharides to monitor glycoprotein endoplasmic reticulum-associated degradation in Saccharomyces cerevisiae
Abstract
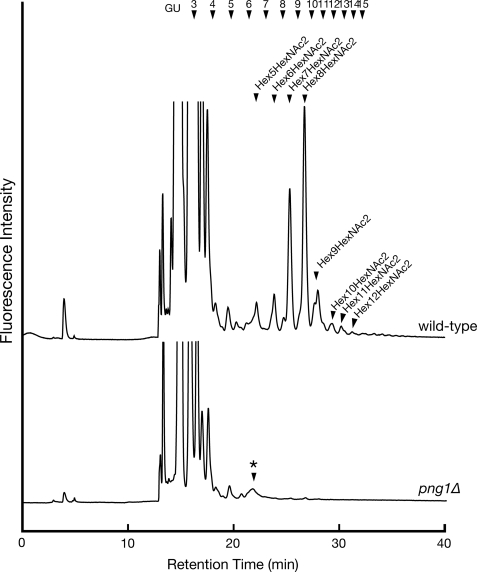
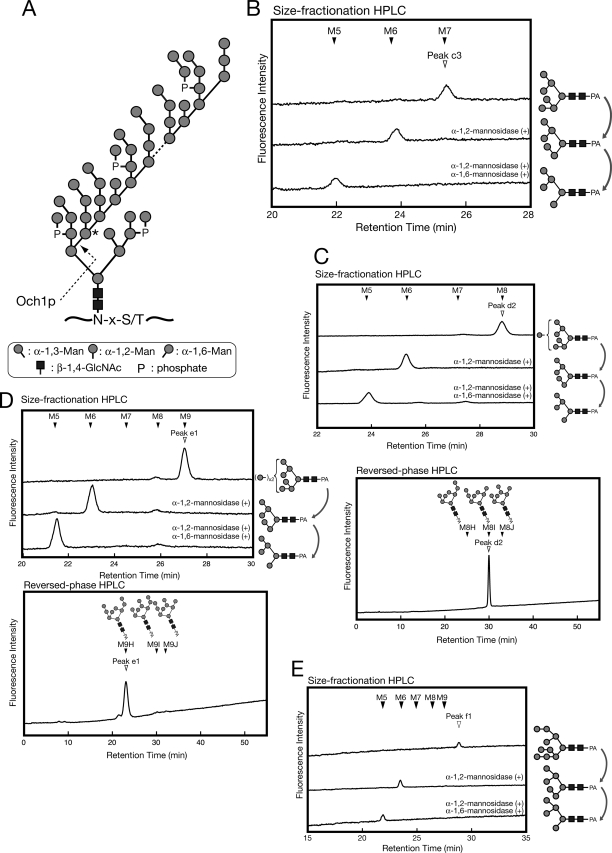
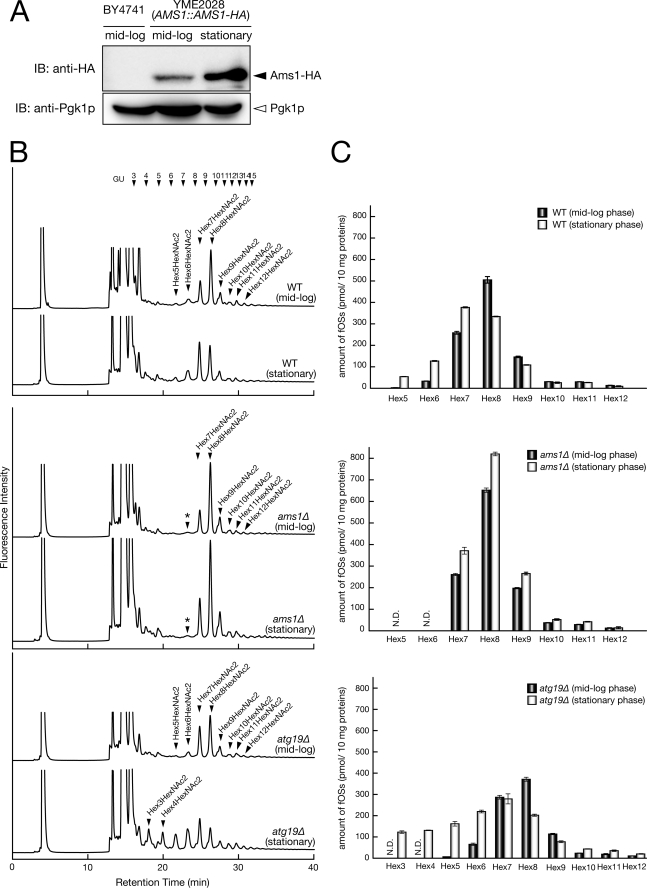
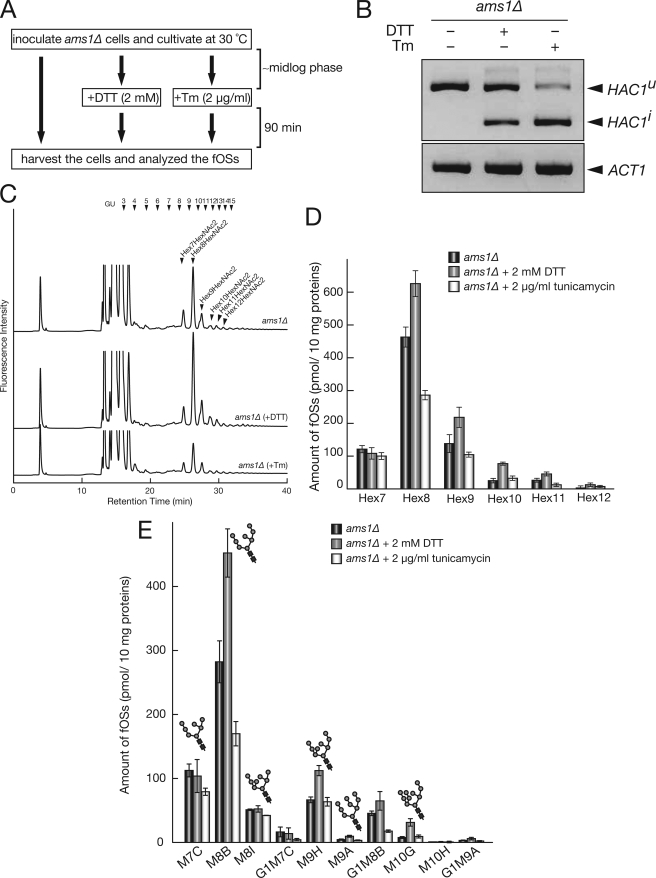
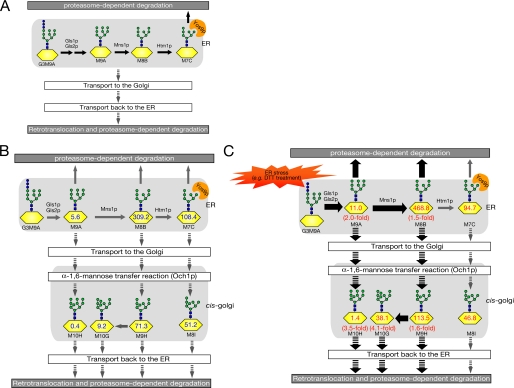
In eukaryotic cells, N-glycosylation has been recognized as one of the most common and functionally important co- or post-translational modifications of proteins. "Free" forms of N-glycans accumulate in the cytosol of mammalian cells, but the precise mechanism for their formation and degradation remains unknown. Here, we report a method for the isolation of yeast free oligosaccharides (fOSs) using endo-beta-1,6-glucanase digestion. fOSs were undetectable in cells lacking PNG1, coding the cytoplasmic peptide:N-glycanase gene, suggesting that almost all fOSs were formed from misfolded glycoproteins by Png1p. Structural studies revealed that the most abundant fOS was M8B, which is not recognized well by the endoplasmic reticulum-associated degradation (ERAD)-related lectin, Yos9p. In addition, we provide evidence that some of the ERAD substrates reached the Golgi apparatus prior to retrotranslocation to the cytosol. N-Glycan structures on misfolded glycoproteins in cells lacking the cytosol/vacuole alpha-mannosidase, Ams1p, was still quite diverse, indicating that processing of N-glycans on misfolded glycoproteins was more complex than currently envisaged. Under ER stress, an increase in fOSs was observed, whereas levels of M7C, a key glycan structure recognized by Yos9p, were unchanged. Our method can thus provide valuable information on the molecular mechanism of glycoprotein ERAD in Saccharomyces cerevisiae.
Figures
Similar articles
-
Endoplasmic reticulum-associated degradation (ERAD) and free oligosaccharide generation in Saccharomyces cerevisiae.J Biol Chem. 2011 Dec 2;286(48):41786-41800. doi: 10.1074/jbc.M111.251371. Epub 2011 Oct 6. J Biol Chem. 2011. PMID: 21979948 Free PMC article.
-
Yeast N-glycanase distinguishes between native and non-native glycoproteins.EMBO Rep. 2004 Feb;5(2):201-6. doi: 10.1038/sj.embor.7400066. Epub 2004 Jan 9. EMBO Rep. 2004. PMID: 14726951 Free PMC article.
-
Identification of an Htm1 (EDEM)-dependent, Mns1-independent Endoplasmic Reticulum-associated Degradation (ERAD) pathway in Saccharomyces cerevisiae: application of a novel assay for glycoprotein ERAD.J Biol Chem. 2010 Aug 6;285(32):24324-34. doi: 10.1074/jbc.M109.095919. Epub 2010 May 28. J Biol Chem. 2010. PMID: 20511219 Free PMC article.
-
Physiological and molecular functions of the cytosolic peptide:N-glycanase.Semin Cell Dev Biol. 2015 May;41:110-20. doi: 10.1016/j.semcdb.2014.11.009. Epub 2014 Dec 2. Semin Cell Dev Biol. 2015. PMID: 25475175 Review.
-
Free oligosaccharide regulation during mammalian protein N-glycosylation.Glycobiology. 2008 Mar;18(3):210-24. doi: 10.1093/glycob/cwn003. Epub 2008 Jan 24. Glycobiology. 2008. PMID: 18218706 Review.
Cited by
-
Mitotic phosphorylation inhibits the Golgi mannosidase MAN1A1.Cell Rep. 2022 Nov 22;41(8):111679. doi: 10.1016/j.celrep.2022.111679. Cell Rep. 2022. PMID: 36417860 Free PMC article.
-
A bioactive mammalian disaccharide associated with autoimmunity activates STING-TBK1-dependent immune response.Nat Commun. 2019 May 30;10(1):2377. doi: 10.1038/s41467-019-10319-5. Nat Commun. 2019. PMID: 31147550 Free PMC article.
-
Total cellular glycomics allows characterizing cells and streamlining the discovery process for cellular biomarkers.Proc Natl Acad Sci U S A. 2013 Feb 5;110(6):2105-10. doi: 10.1073/pnas.1214233110. Epub 2013 Jan 23. Proc Natl Acad Sci U S A. 2013. PMID: 23345451 Free PMC article.
-
Basal autophagy is required for the efficient catabolism of sialyloligosaccharides.J Biol Chem. 2013 Sep 13;288(37):26898-907. doi: 10.1074/jbc.M113.464503. Epub 2013 Jul 23. J Biol Chem. 2013. PMID: 23880766 Free PMC article.
-
Uncoupling the hydrolysis of lipid-linked oligosaccharide from the oligosaccharyl transfer reaction by point mutations in yeast oligosaccharyltransferase.J Biol Chem. 2020 Nov 20;295(47):16072-16085. doi: 10.1074/jbc.RA120.015013. Epub 2020 Sep 16. J Biol Chem. 2020. PMID: 32938717 Free PMC article.
References
-
- Kornfeld R., Kornfeld S. (1985) Annu. Rev. Biochem. 54, 631–664 - PubMed
-
- Lehle L., Strahl S., Tanner W. (2006) Angew. Chem. Int. Ed. Engl. 45, 6802–6818 - PubMed
-
- Helenius A., Aebi M. (2004) Annu. Rev. Biochem. 73, 1019–1049 - PubMed
-
- Ou W. J., Cameron P. H., Thomas D. Y., Bergeron J. J. (1993) Nature 364, 771–776 - PubMed
Publication types
MeSH terms
Substances
LinkOut - more resources
Full Text Sources
Other Literature Sources
Molecular Biology Databases
