. 2010 Apr;176(4):1767-78.
doi: 10.2353/ajpath.2010.090345. Epub 2010 Feb 11.

Autophagy is a component of epithelial cell fate in obstructive uropathy

Affiliations

Autophagy is a component of epithelial cell fate in obstructive uropathy

Ling Li et al. Am J Pathol. 2010 Apr.

Abstract

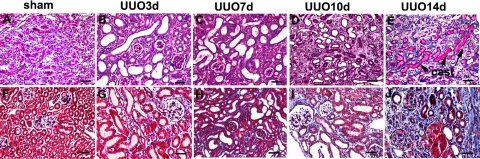
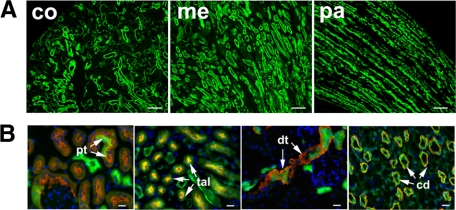
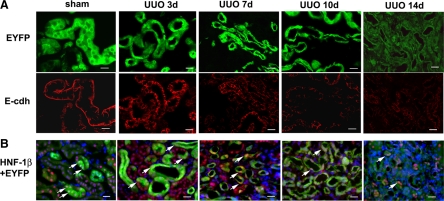
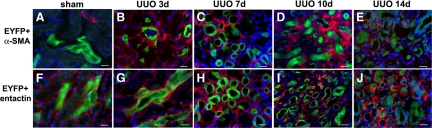
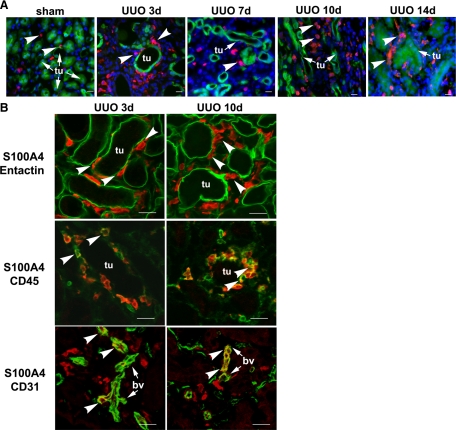
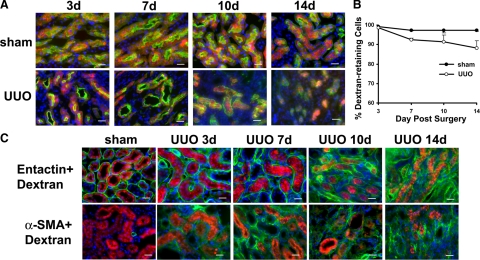
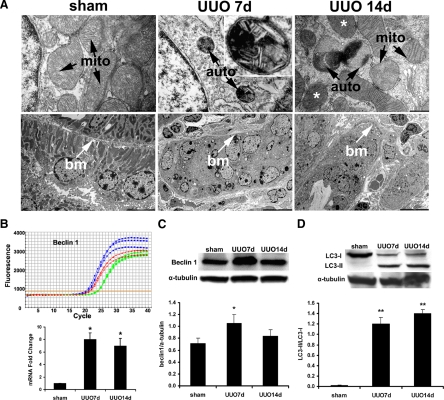
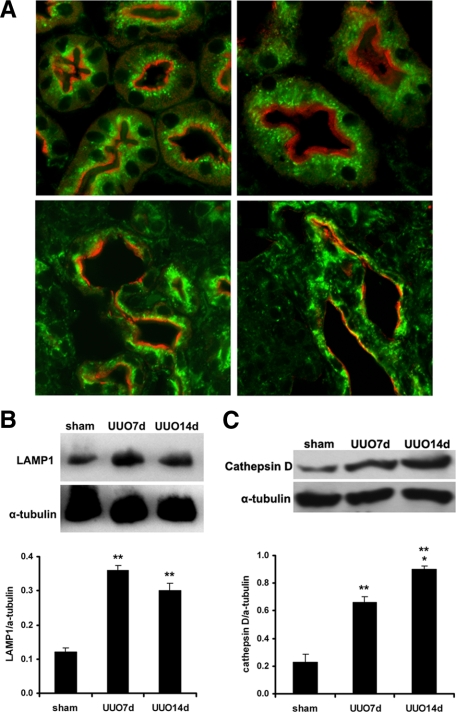
Epithelial cell fate and nephron loss in obstructive uropathy are not fully understood. We produced transgenic mice in which epithelial cells in the nephrons and collecting ducts were labeled with enhanced yellow fluorescent protein, and tracked the fate of these cells following unilateral ureteral obstruction (UUO). UUO led to a decrease in the number of enhanced yellow fluorescent protein-expressing cells and down-regulation of epithelial markers, E-cadherin, and hepatocyte nuclear factor-1beta. Following UUO, enhanced yellow fluorescent protein-positive cells were confined within the tubular basement membrane, were not found in the renal interstitium, and did not express alpha-smooth muscle actin or S100A4, markers of myofibroblasts and fibroblasts. Moreover, when proximal tubules were labeled with dextran before UUO, dextran-retaining cells did not migrate into the interstitium or express alpha-smooth muscle actin. These results indicate that UUO leads to tubular epithelial loss but does not cause epithelial-to-mesenchymal transition that has been shown by others to be responsible for nephron loss and interstitial fibrosis. For the first time, we found evidence of enhanced autophagy in obstructed tubules, including accumulation of autophagosomes, increased expression of Beclin 1, and increased conversion of microtubular-associated protein 1 light chain 3-I to -II. Increased autophagy may represent a mechanism of tubular survival or may contribute to excessive cell death and tubular atrophy after obstructive injury.


Figures

Figure 1
Figure 1
Tubular atrophy and interstitial fibrosis following unilateral uteral obstruction (UUO). periodic acid-Schiff (top row) and trichrome (bottom row) staining of the kidneys from mice with sham-operation (A, F), and 3 to 14 days (BE, GJ) post UUO. Three days after UUO, significant tubular dilation is observed (B) and interstitial fibrosis starts to appear (G). Tubular dilatation is followed by tubular atrophy after prolonged obstruction. At 14 days post UUO, pronounced tubular atrophy (E) and interstitial fibrosis (J) are evidenced. Cast, proteinaceous casts in the lumen of the tubules at 14 days post UUO (E). Scale bar = 50 μm.
Figure 2
Figure 2
Renal tubular expression of EYFP in control Creksp;R26R-EYFP mice. A: Low power views of EYFP expression (green) in renal cortex (co), medulla (me) and papilla (pa). Scale bar = 50 μm. B: EYFP (green) is expressed in proximal tubules (pt) stained with LTA (red), and other nephron segments with antibodies to Na-K-Cl co-transporter (red) for thick ascending limbs (tal), NCX1 (red) to distal tubules and connecting tubules (dt), and AQP3 (red) to collecting ducts (cd). Scale bar = 20 μm.
Figure 3
Figure 3
Loss of mature tubular epithelial cell expression pattern after prolonged UUO. A: Decreased expression of EYFP and E-cadherin. Normal renal tubular epithelial cells in Creksp;R26R-EYFP mice express EYFP in the cytoplasm (green) and E-cadherin at the basolateral aspect (red). With ureteral obstruction, tubular atrophy occurs as indicated by the decrease in EYFP-expressing cells. E-cadherin expression is down-regulated in the corresponding tubules. E-cdh, E-cadherin. B: Decreased expression of epithelial marker HNF-1β. HNF-1β expression (red) is decreased in EYFP-expressing epithelial cells (green) following UUO. Arrows indicate the nuclear expression of HNF-1β. Nuclei are counterstained with DAPI (blue). Scale bar = 20 μm.
Figure 4
Figure 4
Tubular epithelial cells do not migrate outside the tubular basement and become myofibroblasts during interstitial fibrosis in Creksp;R26R-EYFP mice. A−E: Immunostaining of α-SMA (red) and EYFP (green) in the kidneys of the control (A), and 3 to 14 days after UUO (B−E) shows the absence of α-SMA expression in EYFP-positive tubular cells. There are abundant α-SMA-expressing cells in the interstitium. F−J: EYFP (green) and tubular basement membrane marker entactin (red) staining shows that all EYFP-positive cells are confined within the tubular basement membrane in the kidneys of the control (F) and 3 to 14 days after UUO (G−J). Nuclei are counterstained with DAPI (blue). Scale bar = 20 μm.
Figure 5
Figure 5
EYFP-positive tubular cells do not express S100A4 in Creksp;R26R-EYFP mice. A: No expression of S100A4 (red, arrowheads) was detected in EYFP-positive tubular cells (green) in control and 3 to 14 days after UUO. Nuclei are counterstained with DAPI (blue). B: All S100A4 expressing cells (red, arrowheads) are localized to the interstitium and outside the dilated tubules stained with the tubular basement membrane marker entactin (green). Some S100A4-expressing cells (red) in the peritubular areas co-express leukocyte maker CD45 (green, arrowheads), and some S100A4-expressing cells (red) co-express endothelial maker CD31 (green, arrowheads) in the blood vessels (bv). tu, tubules. Scale bar = 20 μm.
Figure 6
Figure 6
Dextran-retaining cells are confined to the proximal tubules and do not express α-SMA in C57BL/6 mice. A: Proximal tubules identified by their binding with LTA (green) are labeled with a Texas-red conjugated small molecular weight dextran (red) in mice with sham-operation or UUO for 3 to 14 days. B: 89% to 98% of the proximal tubular cells retain dextran in the control and UUO groups. No statistically significant difference in dextran-retaining cells is detected between the control and UUO groups. Values represent mean ± SE. n = 3 to 5. C: Dextran-retaining cells (red) are confined inside the tubular basement membrane stained with entactin (green, top panel) and do not express myofibroblast marker a-SMA (green, bottom panel) in control and 3 to 14 days after UUO. Nuclei are counterstained with DAPI (blue). Scale bar = 20 μm.
Figure 7
Figure 7
Increased autophagy in the kidneys with UUO. A: Increased formation of autophagic vacuoles and tubular atrophy after UUO. Transmission electron microscopy images show normal structures of the nucleus, mitochondria, and other cellular organelles in the control kidney, and the presence of double membrane vacuoles containing electron dense material and compressed mitochondria with the loss of visible cristae 7 and 14 days after UUO (top panel). Inset shows higher magnification of an autophagosome. Mitochondria with nonautophagy-related internal structural alterations, such as heterogeneously distributed internal cristae and matrix, are indicated by the asterisks. The bottom panel shows normal tubules in control kidneys, and atrophic tubules in the kidneys after 7 and 14 days UUO. mito, mitochondria; auto, autophagic vacuoles; bm, tubular basement membrane. Scale bars: 500 nm (top panel); 5000 nm (left image on the bottom panel); and 10,000 nm (middle and right images on the bottom panel). B and C: Increased expression of Beclin 1 mRNA detected by real time RT-PCR analysis (B) and Beclin 1 protein detected by immunoblot analysis (C) after UUO. In the representative real time RT-PCR tracing, green curves represent sham, blue curves represent 7 days and red curves represent 14 days after UUO. The mRNA levels are quantified after normalization with 18S rRNA and the protein levels are quantified after normalization with α-tubulin protein. D: Increased conversion of LC3-I to LC3-II proteins. Values represent mean ± SE. n = 3 for each experimental group. *P < 0.05, and **P < 0.001 compared with sham-operated control group.
Figure 8
Figure 8
Expression of lysosomal membrane protein LAMP-1 and lysosomal enzyme cathepsin D. A: Co-immunostaining of LAMP-1 (green) and proximal tubular marker LTA (red) indicates abundant LAMP-1 signals in a small punctate pattern in proximal tubules in controls (left upper image) and 3 days post UUO (right upper image). LAMP-1 signals become enhanced and are in a coarse and granular pattern 7 days (left lower image) and 14 days (right lower image) post UUO. B: Immunoblot analysis indicates increased LAMP-1 protein levels post UUO. C: Immunoblot analysis indicates increased cathepsin D protein levels post UUO. Values represent mean ± SE. n = 3 for each experimental group. **P < 0.001 between sham and 7 days or 14 days post UUO.

Similar articles

Cited by

References

    1. Smith JM, Stablein DM, Munoz R, Hebert D, McDonald RA. Contributions of the transplant registry: the 2006 annual report of the North American Pediatric Renal Trials and Collaborative Studies (NAPRTCS). Pediatr Transplant. 2007;11:366–373. - PubMed
    1. Chevalier RL. Pathogenesis of renal injury in obstructive uropathy. Curr Opin Pediatr. 2006;18:153–160. - PubMed
    1. Chevalier RL, Peters CA. Congenital urinary tract obstruction: proceedings of the State-Of-The-Art Strategic Planning Workshop-National Institutes of Health. Bethesda, Maryland, 11–12 March 2002. Pediatr Nephrol. 2003;18:576–606. - PubMed
    1. Woolf AS, Price KL, Scambler PJ, Winyard PJ. Evolving concepts in human renal dysplasia. J Am Soc Nephrol. 2004;15:998–1007. - PubMed
    1. Potter E. Normal and abnormal development of the kidney. Chicago: Year Book Medical Publishers,; 1972:pp. 1–305.

Publication types

MeSH terms