. 2010 Apr;176(4):1756-66.
doi: 10.2353/ajpath.2010.090500. Epub 2010 Feb 11.

Role of insulin-like growth factor binding protein 2 in lung adenocarcinoma: IGF-independent antiapoptotic effect via caspase-3

Affiliations

Role of insulin-like growth factor binding protein 2 in lung adenocarcinoma: IGF-independent antiapoptotic effect via caspase-3

Toshiro Migita et al. Am J Pathol. 2010 Apr.

Abstract

Insulin-like growth factor (IGF) signaling plays a pivotal role in cell proliferation and mitogenesis. Secreted IGF-binding proteins (IGFBPs) are important modulators of IGF bioavailability; however, their intracellular functions remain elusive. We sought to assess the antiapoptotic properties of intracellular IGFBP-2 in lung adenocarcinomas. IGFBP-2 overexpression resulted in a decrease in procaspase-3 expression; however, it did not influence the phosphorylation status of either IGF receptor or its downstream targets, including Akt and extracellular signal-regulated kinase. Apoptosis induced by camptothecin was significantly inhibited by IGFBP-2 overexpression in NCI-H522 cells. Conversely, selective knockdown of IGFBP-2 using small-interfering RNA resulted in an increase in procaspase-3 expression and sensitization to camptothecin-induced apoptosis in NCI-H522 cells. LY294002, an inhibitor of phosphatidyl-inositol 3-kinase, caused a decrease in IGFBP-2 levels and enhanced apoptosis in combination with camptothecin. Immunohistochemistry demonstrated that intracellular IGFBP-2 was highly expressed in lung adenocarcinomas compared with normal epithelium. Intracellular IGFBP-2 and procaspase-3 were expressed in a mutually exclusive manner. These findings suggest that intracellular IGFBP-2 regulates caspase-3 expression and contributes to the inhibitory effect on apoptosis independent of IGF. IGFBP-2, therefore, may offer a novel therapeutic target and serve as an antiapoptotic biomarker for lung adenocarcinoma.


Figures

Figure 1
Figure 1
A: Basal levels of intracellular IGFBP-2 protein in seven lung adenocarcinoma cell lines. Cells (5 × 10⁵) were plated in a 60-mm dish and cultured for 48 hours. The protein extracts from each cell line were resolved by SDS-polyacrylamide gel electrophoresis and blotted with an antibody against IGFBP-2. β-actin served as internal control. A representative data from two independent experiments is shown. B: Conditioned media containing a different amount of IGFBP-2 in lung adenocarcinoma cell lines. Secreted IGFBP-2 was measured, under the same conditions as above, by ELISA. Values represent means ± SD.
Figure 2
Figure 2
A: The effect of glucose and fetal bovine serum on intracellular IGFBP-2 levels. A549 cells (5 × 10⁵) were incubated for 2 hours in fetal bovine serum (FBS) free media, followed by a 24-hour incubation in glucose free, FBS free, or regular media. The cells were then harvested and subjected to both immunoblotting and quantitative RT-PCR for IGFBP-2. IGFBP-2 mRNA was normalized to human β2 microglobulin (B2M). Values represent means ± SD. Statistical analysis was performed by Welch’s t-test. *P < 0.01. B: A549 cells were cultured in media with the indicated concentrations of glucose for 24 hours. IGFBP-2 expression levels were measured by both immunoblotting and quantitative RT-PCR. Values represent means ± SD. Significant slope of regression line between IGFBP-2 mRNA and glucose concentration was obtained (P = 0.012). C: Effect of LY294002, a PI3K inhibitor, on extracellular IGFBP-2 levels. Seven lung adenocarcinoma cell lines were treated either with a vehicle control DMSO (white bar) or 20 μmol/L of LY294002 (black bar) for 24 hours. Secreted IGFBP-2 was measured by ELISA as described before. D: A549 cells were treated with the indicated concentration of LY294002 for 24 hours. A significant slope of regression line between secreted IGFBP-2 and LY294002 concentration was obtained (P = 0.0048). E: Time course of IGFBP-2 secretion in A549 cells treated with 20 μmol/L of LY294002. The 95% CI based test of slope regression was significant (P < 0.05): 0.134 to 0.18 vs. 0.029 to 0.043, in control DMSO and LY294002, respectively. F: The effect of LY294002 on intracellular levels of IGFBP-2. A549 cells were treated with the indicated concentration of LY294002, followed by immunoblotting for IGFBP-2, phosphorylated Akt (Ser 473), and β-actin. S, short exposure; L, long exposure. G: A549 cells were treated with the indicated concentration of LY294002, and IGFBP-2 mRNA levels were evaluated by a real-time RT-PCR. Values represent means ± SD. Statistical analysis was performed by Welch’s t-test. *P < 0.01.
Figure 3
Figure 3
A: IGFBP-2 overexpression inhibits procaspase-3 expression independent of the IGF signaling pathway. Empty vector (EV) and IGFBP-2 (BP2) were transfected in COR-L105, NCI-H522, and HOP62 lung adenocarcinoma cell lines, and stably IGFBP-2 overexpressing cells were obtained. Whole cell lysates were subjected to SDS-polyacrylamide gel electrophoresis, followed by immunoblotting for IGFBP-2, procaspase-3, procaspase-9, phosphorylated and total IGF-1R, phosphorylated and total Akt, phosphorylated and total Erk1/2, and β-actin. Signal densities were quantified by ImageJ, and then procaspase-3/β-actin, procaspase-9/β-actin, p-IGF1R/T-IGF1R, p-Akt/T-Akt, and p-Erk1/2/T-Erk1/2 ratios were calculated. B: Secreted IGFBP-2 levels were measured by ELISA in three different stable vector- and IGFBP-2-transfected (white and black bars, respectively) cell lines. Data represent means ± SD. C: IGFBP-2 overexpressing and empty vector NCI-H522 cells were plated in 96 wells and treated with indicated concentration of camptothecin for 24 hours. Cell proliferation was determined by microplate reader using cell count reagent. Data represent means ± SD. The IC50 values were 686 nmol/L and more than 1000 nmol/L in empty vector and IGFBP-2 cells, respectively. D: Caspase-3 assay in IGFBP-2 overexpressing and empty vector NCI-H522 cells. Cells were plated in 96 wells and treated with 200 nmol/L of camptothecin for 24 hours. Caspase-3 activity was determined by a microplate reader. Data represent means ± SD. Statistical analysis of comparison between empty vector and IGFBP-2 overexpressing cells was performed by Welch’s t-test. EV (camptothecin/DMSO) versus BP2 (camptothecin/DMSO); *P < 0.02. E: Apoptosis was also evaluated by immunoblotting for PARP cleavage with whole cell lysate. F: Twenty-four hours after exposure of 200 nmol/L of camptothecin, cells were stained with Hoechst 33342. Apoptotic and nonapoptotic cells were counted by microscopy at least in three different areas, and the apoptotic rate was represented. Values represent means ± SD. Statistical analysis was performed by Welch’s t-test. *P < 0.01.
Figure 4
Figure 4
A: Specific IGFBP-2 inhibition resulted in the increase in procaspase-3. A549 or NCI-H522 cells were transfected with negative control or IGFBP-2 siRNA oligonucleotides, followed by immunoblot for IGFBP-2, procaspase-3, procaspase-9, phosphorylated and total IGF-1R, and β-actin at indicated times after transfection. Signal densities were quantified by ImageJ, and then procaspase-3/β-actin, Procaspase-9/β-actin, and p-IGF1R/T-IGF1R ratios were calculated. B: NCI-H522 cells were treated with negative control or IGFBP-2 siRNA for 24 hours and then exposed to different concentrations of camptothecin for 24 hours. Cell proliferation was determined as described before. Data represent means ± SD. A 95% CI based test of slope regression was significant (P < 0.05): −2.7E-04 to −1.6E-04 in negative siRNA vs. −4.5E-04 to −3.0E-04 in IGFBP-2 siRNA. C: Caspase-3 assay in NCI-H522 cells treated with negative control or IGFBP-2 siRNA. NCI-H522 cells were treated with negative control or IGFBP-2 siRNA for 48 hours in 96 wells and then treated with 200 nmol/L of camptothecin for 24 hours. Caspase-3 activity was determined by a microplate reader. Data represent means ± SD. Statistical analysis of comparison between negative control and IGFBP-2 siRNA was performed by Welch’s t-test. *P < 0.0001. D: Twenty-four hours after exposure of 200 nmol/L of camptothecin, siRNA-treated NCI-H522 cells were stained with Hoechst 33342. The apoptotic rate was measured as described previously. Values represent means ± SD. Statistical analysis was performed by Welch’s t-test. *P < 0.001. E: Apoptosis was also evaluated by immunoblot for PARP cleavage in NCI-H522 cells. F: NCI-H522 and COR-L105 cells were treated with 20 μmol/L of LY294002 or 200 nmol/L of camptothecin or combination of LY294002 and camptothecin for 24 hours. Immunoblot was performed with IGFBP-2, cleaved PARP, and β-actin antibodies.
Figure 5
Figure 5
A: IGFBP-2 mRNA expression was measured by real-time RT-PCR in 24 pairs of human normal and corresponding tumor tissue. The mRNA levels of IGFBP-2 are presented as arbitrary units for the mRNA levels of human β2 microglobulin (B2M). A paired t-test was used for statistical significance (*P = 0.021). B: Representative picture of Western blots. IGFBP-2 protein levels were measured with four pairs of normal (N) and corresponding tumor (T) tissue from lung adenocarcinoma patients.
Figure 6
Figure 6
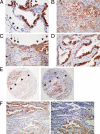
A: Representative pictures of immunohistochemistry for IGFBP-2 in lung adenocarcinomas. Note a strong immunoreactivity in cytoplasm of cancer cells, whereas almost negligible in normal epithelium (arrowheads). B: Typical membraneous IGFBP-2 expression. C: IGFBP-2 expression is gradually increased from benign cells (arrows) to malignant cells (arrowheads). D: Strong IGFBP-2 expression is only localized in cancer cells with high nuclear grade. E: Representative mutually exclusive expression between IGFBP-2 (left, arrowheads) and procaspase-3 (right, arrowheads) in serial sections on tissue microarray. F: Another case also demonstrates an inverse expression pattern between IGFBP-2 (left) and procaspase-3 (right) in serial sections. Original magnification: ×400 (AD, and F); ×100 (E).

Similar articles

Cited by

References

    1. Pereira JJ, Meyer T, Docherty SE, Reid HH, Marshall J, Thompson EW, Rossjohn J, Price JT. Bimolecular interaction of insulin-like growth factor (IGF) binding protein-2 with alphavbeta3 negatively modulates IGF-I-mediated migration and tumor growth. Cancer Res. 2004;64:977–984. - PubMed
    1. Wang GK, Hu L, Fuller GN, Zhang W. An interaction between insulin-like growth factor-binding protein 2 (IGFBP2) and integrin alpha5 is essential for IGFBP2-induced cell mobility. J Biol Chem. 2006;281:14085–14091. - PubMed
    1. Russo VC, Bach LA, Fosang AJ, Baker NL, Werther GA. Insulin-like growth factor binding protein-2 binds to cell surface proteoglycans in the rat brain olfactory bulb. Endocrinology. 1997;138:4858–4867. - PubMed
    1. Schutt BS, Langkamp M, Rauschnabel U, Ranke MB, Elmlinger MW. Integrin-mediated action of insulin-like growth factor binding protein-2 in tumor cells. J Mol Endocrinol. 2004;32:859–868. - PubMed
    1. Firth SM, Baxter RC. Cellular actions of the insulin-like growth factor binding proteins. Endocr Rev. 2002;23:824–854. - PubMed

Publication types

MeSH terms