

Metabolic profiling of Arabidopsis thaliana epidermal cells
- PMID: 20150518
- PMCID: PMC2837255
- DOI: 10.1093/jxb/erq002
Metabolic profiling of Arabidopsis thaliana epidermal cells
Abstract
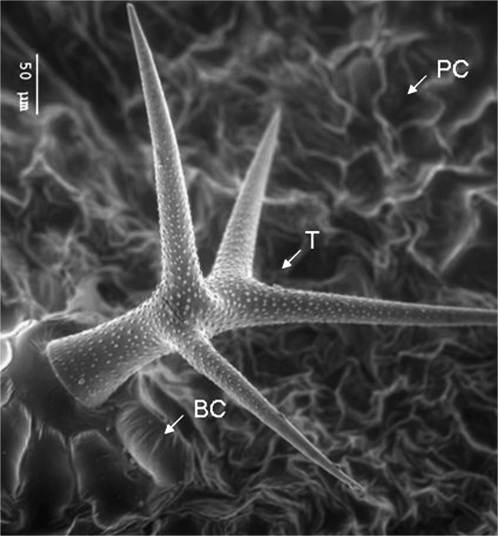
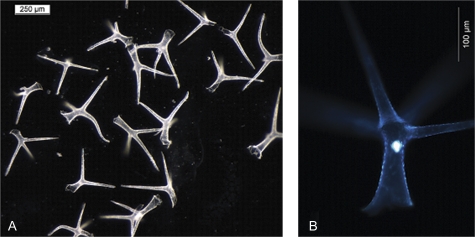
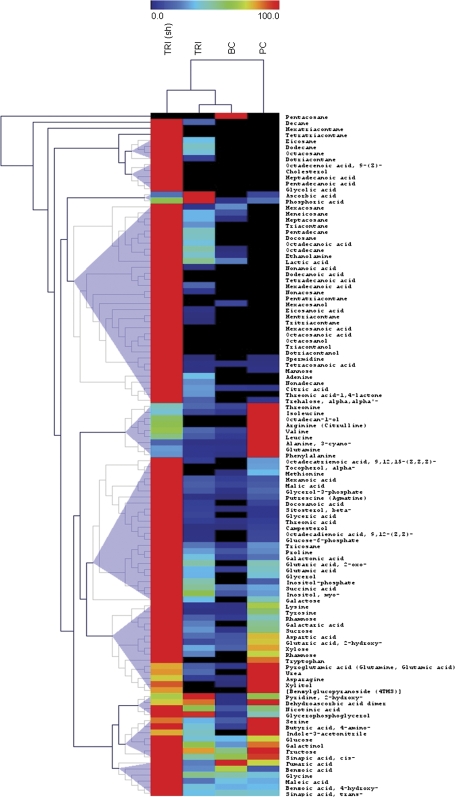
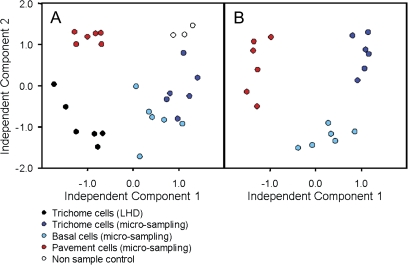
Metabolic phenotyping at cellular resolution may be considered one of the challenges in current plant physiology. A method is described which enables the cell type-specific metabolic analysis of epidermal cell types in Arabidopsis thaliana pavement, basal, and trichome cells. To achieve the required high spatial resolution, single cell sampling using microcapillaries was combined with routine gas chromatography-time of flight-mass spectrometry (GC-TOF-MS) based metabolite profiling. The identification and relative quantification of 117 mostly primary metabolites has been demonstrated. The majority, namely 90 compounds, were accessible without analytical background correction. Analyses were performed using cell type-specific pools of 200 microsampled individual cells. Moreover, among these identified metabolites, 38 exhibited differential pool sizes in trichomes, basal or pavement cells. The application of an independent component analysis confirmed the cell type-specific metabolic phenotypes. Significant pool size changes between individual cells were detectable within several classes of metabolites, namely amino acids, fatty acids and alcohols, alkanes, lipids, N-compounds, organic acids and polyhydroxy acids, polyols, sugars, sugar conjugates and phenylpropanoids. It is demonstrated here that the combination of microsampling and GC-MS based metabolite profiling provides a method to investigate the cellular metabolism of fully differentiated plant cell types in vivo.
Figures
Similar articles
-
In situ metabolic analysis of single plant cells by capillary microsampling and electrospray ionization mass spectrometry with ion mobility separation.Analyst. 2014 Oct 21;139(20):5079-85. doi: 10.1039/c4an01018c. Epub 2014 Aug 11. Analyst. 2014. PMID: 25109271
-
The composition of surface wax on trichomes of Arabidopsis thaliana differs from wax on other epidermal cells.Plant J. 2016 Dec;88(5):762-774. doi: 10.1111/tpj.13294. Epub 2016 Sep 17. Plant J. 2016. PMID: 27496682
-
Protein profiling of single epidermal cell types from Arabidopsis thaliana using surface-enhanced laser desorption and ionization technology.J Plant Physiol. 2008 Aug 25;165(12):1227-37. doi: 10.1016/j.jplph.2008.01.006. Epub 2008 Apr 18. J Plant Physiol. 2008. PMID: 18423788
-
Unbiased characterization of genotype-dependent metabolic regulations by metabolomic approach in Arabidopsis thaliana.BMC Syst Biol. 2007 Nov 21;1:53. doi: 10.1186/1752-0509-1-53. BMC Syst Biol. 2007. PMID: 18028551 Free PMC article.
-
Plant metabolomics reveals conserved and divergent metabolic responses to salinity.Physiol Plant. 2008 Feb;132(2):209-19. doi: 10.1111/j.1399-3054.2007.00993.x. Physiol Plant. 2008. PMID: 18251862 Review.
Cited by
-
Elucidating the role of transport processes in leaf glucosinolate distribution.Plant Physiol. 2014 Nov;166(3):1450-62. doi: 10.1104/pp.114.246249. Epub 2014 Sep 10. Plant Physiol. 2014. PMID: 25209984 Free PMC article.
-
Advances in single-cell metabolomics to unravel cellular heterogeneity in plant biology.Plant Physiol. 2023 Sep 22;193(2):949-965. doi: 10.1093/plphys/kiad357. Plant Physiol. 2023. PMID: 37338502 Free PMC article. Review.
-
Identification and Quantification of Coumarins by UHPLC-MS in Arabidopsis thaliana Natural Populations.Molecules. 2021 Mar 23;26(6):1804. doi: 10.3390/molecules26061804. Molecules. 2021. PMID: 33806877 Free PMC article.
-
Plant systems biology: insights, advances and challenges.Planta. 2014 Jul;240(1):33-54. doi: 10.1007/s00425-014-2059-5. Epub 2014 Mar 27. Planta. 2014. PMID: 24671625 Review.
-
Abscisic acid-responsive guard cell metabolomes of Arabidopsis wild-type and gpa1 G-protein mutants.Plant Cell. 2013 Dec;25(12):4789-811. doi: 10.1105/tpc.113.119800. Epub 2013 Dec 24. Plant Cell. 2013. PMID: 24368793 Free PMC article.
References
-
- Arlt K, Brandt S, Kehr J. Amino acid analysis in five pooled single plant cell samples using capillary electrophoresis coupled to laser-induced fluorescence detection. Journal of Chromatography A. 2001;926:319–325. - PubMed
-
- Barber GA, Neufeld EF. Rhamnosyl transfer from TDPL-rhamnose catalyzed by a plant enzyme. Biochemical and Biophysical Research Communications. 1961;6:44–48. - PubMed
-
- Bar-Peled M, Lewinsohn E, Fluhr R, Gressel J. UDP-rhamnose:flavanone-7-O-glucoside-2″- O-rhamnosyltransferase. Purification and characterization of an enzyme catalyzing the production of bitter compounds in citrus. Journal of Biological Chemistry. 1991;266:20953–20959. - PubMed
-
- Bazzanella A, Lochmann H, Tomos AD, Bächmann K. Determination of inorganic cations and anions in single plant cells by capillary zone electrophoresis. Journal of Chromatography A. 1998;809:231–239. - PubMed
-
- Bino RJ, Hall RD, Fiehn O, et al. Potential of metabolomics as a functional genomics tool. Trends in Plant Science. 2004;9:418–425. - PubMed
Publication types
MeSH terms
LinkOut - more resources
Full Text Sources
Miscellaneous
