. 2010 Apr 16;285(16):11880-91.
doi: 10.1074/jbc.M110.109843. Epub 2010 Feb 11.

A role for Sp1 in transcriptional regulation of phosphatidylethanolamine N-methyltransferase in liver and 3T3-L1 adipocytes

Affiliations

A role for Sp1 in transcriptional regulation of phosphatidylethanolamine N-methyltransferase in liver and 3T3-L1 adipocytes

Laura K Cole et al. J Biol Chem. .

Abstract

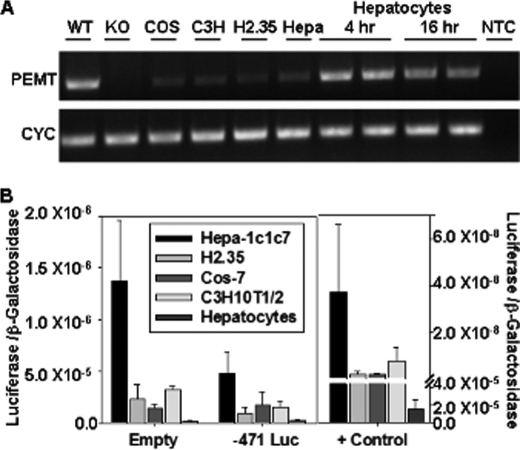
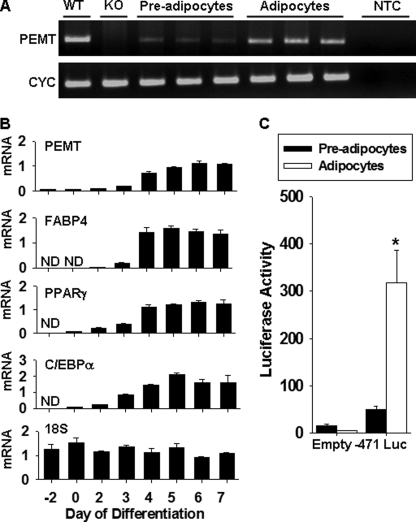
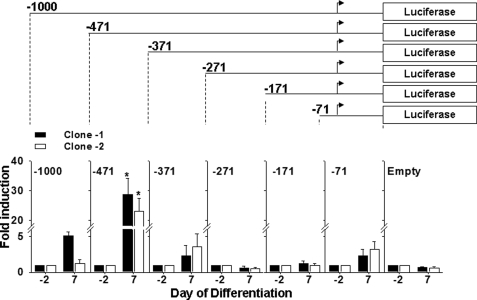
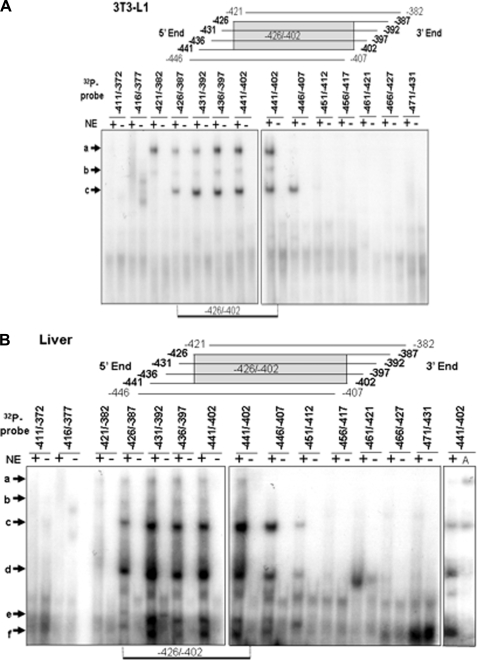
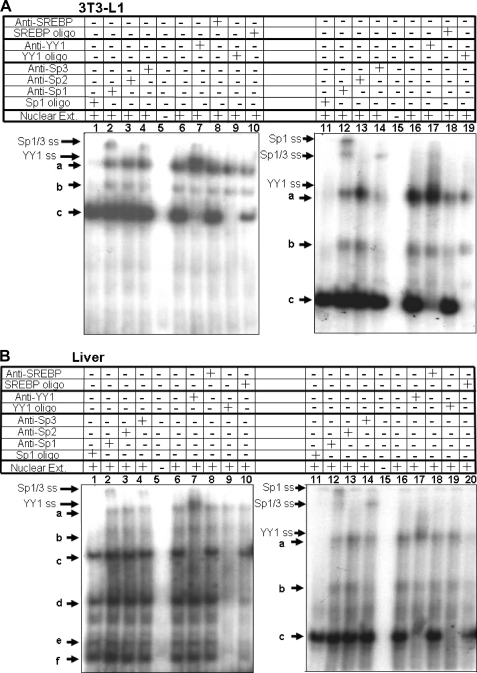
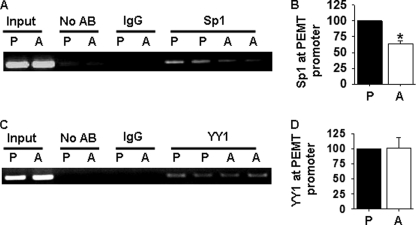
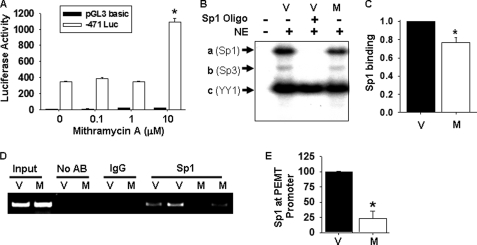
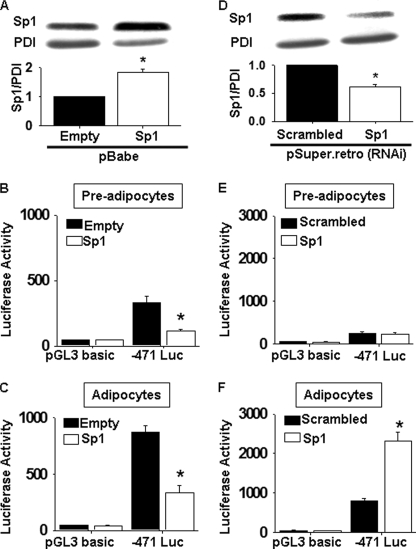
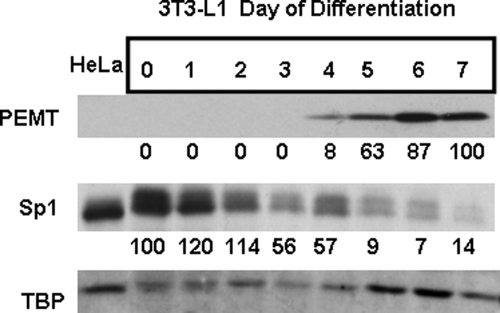
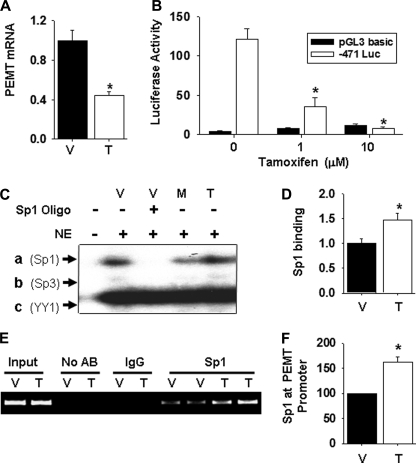
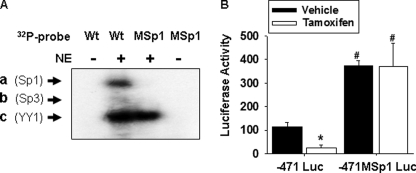
Phosphatidylcholine is made in all nucleated mammalian cells via the CDP-choline pathway. Another major pathway for phosphatidylcholine biosynthesis in liver is catalyzed by phosphatidylethanolamine N-methyltransferase (PEMT). We have now identified 3T3-L1 adipocytes as a cell culture model that expresses PEMT endogenously. We have found that PEMT mRNA and protein levels increased dramatically in 3T3-L1 cells upon differentiation to adipocytes. 5'-Deletion analysis of the PEMT promoter-luciferase constructs stably expressed in 3T3-L1 adipocytes identified a regulatory region between -471 and -371 bp (relative to the transcriptional start site). Competitive and supershift assays demonstrated binding sites for transcription factors Sp1, Sp3 (-408 to -413), and YY1 (-417 to -420). During differentiation of 3T3-L1 cells to adipocytes, the amount of Sp1 protein decreased by approximately 50% just prior to activation of PEMT. Transduction of 3T3-L1 adipocytes with retrovirus containing Sp1 cDNA demonstrated that Sp1 inhibited PEMT transcriptional activity. Similarly, short hairpin RNA directed against Sp1 in 3T3-L1 adipocytes enhanced PEMT transcriptional activation. Chromatin immunoprecipitation assays confirmed that Sp1 binds to the PEMT promoter, and this interaction decreases upon differentiation to adipocytes. These experiments directly link increased PEMT expression in adipocytes to decreased transcriptional expression of Sp1. In addition, our data established that Sp1 binding was required for tamoxifen-mediated inhibition of Pemt promoter activity.


Figures

FIGURE 1.
FIGURE 1.
Expression of PEMT in various cell types. A, total RNA was extracted from COS-7 (COS), C3H10T1/2 (C3H), H2.35, Hepa-1c1c7 (Hepa) cells, and primary mouse hepatocytes, reverse-transcribed to cDNA, and Pemt and cyclophilin (CYC) mRNAs were detected by PCR. Amplicons were visualized with ethidium bromide on a 2% agarose gel. Duplicate samples of isolated primary adult mouse hepatocytes were collected 4 and 16 h post-isolation. Total RNA was isolated from the liver of adult male PEMT wild type (WT) and knock-out (KO) mice for positive and negative controls, respectively. A nontemplate control (NTC) represents a negative control for PCR in the absence of cDNA template. Results are from a single experiment that was repeated once with similar results. B, cells were transiently transfected in duplicate with −471 luciferase (Luc), the empty pGL3 basic vector as a negative control (empty), or the pGL3 control vector containing the SV40 promoter upstream of luciferase cDNA (+ control) as a positive control for transfection efficiency. Luciferase activity was measured 20–48 h post-transfection and expressed relative to β-galactosidase activity. Values represent the means ± S.E. of three independent experiments.
FIGURE 2.
FIGURE 2.
Pemt mRNA is increased during 3T3-L1 differentiation to adipocytes. A, total RNA was extracted from triplicate cultures of 3T3-L1 preadipocytes and adipocytes, reverse-transcribed to cDNA, and Pemt and cyclophilin (CYC) mRNAs were detected by PCR. NTC is a nontemplate control (duplicate lanes). Amplicons were visualized with ethidium bromide on a 2% agarose gel. WT, wild type; KO, knock-out. B, 3T3-L1 fibroblasts were differentiated into adipocytes, and cells were collected on the indicated days. Day 0 indicates 2 days at post-confluence and the start of the differentiation protocol. Total RNA was isolated, reverse-transcribed to cDNA and Pemt, FABP4, peroxisome proliferator-activated receptor γ (PPARγ), and CAAT element-binding protein α mRNA levels measured by quantitative PCR. 18 S RNA levels were measured by quantitative PCR by generating a single-stranded DNA template using the reverse primer. mRNA and 18 S RNA levels were normalized to cyclophilin using a standard curve. All data are means ± S.E. from three separate independent experiments. ND refers to nondetectable amplicon within the indicated sample. C, 3T3-L1 fibroblasts were stably transfected with −471 luciferase (Luc) or the empty pGL3 basic vector (Empty) as a negative control. Luciferase activity was measured in preadipocytes and adipocytes and normalized to cellular protein. Values represent means ± S.E. of three separate independent experiments (*, p < 0.05).
FIGURE 3.
FIGURE 3.
Mouse Pemt promoter region −471/+130 bp is activated during 3T3-L1 differentiation. 3T3-L1 cells stably expressing various lengths of the Pemt promoter upstream of the luciferase reporter gene were generated and differentiated to adipocytes. Cells were collected before (−2) and following (+7) differentiation to adipocytes, and luciferase activity was measured and normalized to cellular protein. The results are reported as fold induction at day 7 compared with luciferase activity at −2 days. Two stable cell lines (clone −1 and clone −2) are shown for each plasmid construct. The negative control was an empty pGL3 basic vector (Empty). Values represent means ± S.E. of four independent experiments (*, p < 0.05).
FIGURE 4.
FIGURE 4.
EMSA analysis of binding of nuclear extracts to Pemt promoter. Sections of the mouse PEMT promoter 40 bp in length were labeled with 32Pi and incubated without (−) or with (+) nuclear extract (NE) isolated from 3T3-L1 adipocytes (A) or mouse liver (B). The resulting DNA-protein complexes (a–f) were separated on 8% polyacrylamide gels and visualized by autoradiography. The results are representative of three independent experiments with similar results. B refers where the nuclear extract is primarily from mouse liver, and A refers to nuclear extract isolated from 3T3-L1 adipocytes.
FIGURE 5.
FIGURE 5.
Supershift analysis of protein binding to the Pemt promoter using EMSA. The −441/−402 section of the mouse Pemt promoter was labeled with 32Pi and incubated without (−) or with (+) nuclear extract from 3T3-L1 cells (A) or mouse liver (B). Unlabeled oligonucleotides containing the consensus sequence for YY1, the Sp family of transcription factors, or sterol response-element binding protein (SREBP) were added to the binding reaction at 100-fold molar excess, as indicated. Antibodies raised against Sp1, Sp2, Sp3, YY1, or SREBP were used in binding reactions as indicated. Resulting DNA-protein complexes (a–f) and supershifted (SS) complexes (indicated by arrowheads) were separated using 8% (left panel) or 7% (right panel) polyacrylamide gels and visualized by autoradiography. The results are representative of three independent experiments with similar results.
FIGURE 6.
FIGURE 6.
Chromatin immunoprecipitation analysis of Sp1 binding to the Pemt promoter. A, in vivo association of Sp1 with the Pemt promoter. Protein-DNA complexes were immunoprecipitated from lysates of 3T3-L1 preadipocytes (P) and adipocytes (A) without or with antibodies (AB) to IgG or Sp1. The Pemt promoter was detected by PCR. DNA purified from sonicated cell lysates was used as a positive control (input). B, results of densitometric analysis of bands from three independent experiments using Sp1 antibody and are means ± S.E. (*, p < 0.05). C, in vivo association of YY1 with the Pemt promoter. Protein-DNA complexes were immunoprecipitated from lysates of 3T3-L1 preadipocytes (P) and adipocytes (A), without or with antibodies (AB) to IgG or YY1. The Pemt promoter was detected by PCR. DNA purified from sonicated cell lysates was used as a positive control (input). D, results of densitometric analysis of bands from three independent experiments using YY1 antibody and are means ± S.E.
FIGURE 7.
FIGURE 7.
Analysis of mithramycin A-mediated inhibition of Sp1 binding to the Pemt promoter. A, 3T3-L1 stably expressing −471 luciferase (Luc) were differentiated to adipocytes and treated with the indicated concentration of mithramycin A (in 1% dimethyl sulfoxide) or vehicle in 10% FBS, DMEM for 24 h. Luciferase activity was normalized to cellular protein. Values are means ± S.E. of three independent experiments (*, p < 0.05). B, 3T3-L1 adipocytes were incubated with vehicle (V) or mithramycin (M, 10 μm) for 24 h. Cells were then washed twice with phosphate-buffered saline. Nuclear extract (NE) was obtained and incubated with 32Pi-labeled Pemt promoter (−441/−402). The resulting DNA-/protein complexes (a–c) were separated on an 8% polyacrylamide gel. A 100-fold molar excess of unlabeled DNA oligonucleotide containing the Sp family consensus sequence was added to the binding reaction as indicated. C, results of densitometric analysis of bands from three independent EMSA experiments are shown as a ratio of intensity of complex a (Sp1) to complex c (YY1) (*, p < 0.05). D, in vivo association of Sp1 with the Pemt promoter. Protein-DNA complexes were immunoprecipitated from lysates of 3T3-L1 adipocytes treated with vehicle (V) or mithramycin (M, 10 μm) for 24 h using antibodies (AB) to IgG or Sp1. The Pemt promoter was detected by PCR. DNA purified from sonicated lysates was used as a positive control (input). E, results of densitometric analysis of band from three independent experiments using Sp1 antibody and are means ± S.E. (*, p < 0.05).
FIGURE 8.
FIGURE 8.
Analysis of influence of Sp1 on Pemt promoter/luciferase activity. A, 3T3-L1 preadipocytes stably expressing the pGL3 basic vector without (pGL3 basic) or with the Pemt promoter section −471 to +130 bp (−471 luciferase (Luc)) upstream of the luciferase reporter gene were treated with retrovirus generated from either an empty pBabe vector (Empty, black bars) or pBabe.puro containing cDNA encoding Sp1 (Sp1, white bars). Cell lysates from 3T3-L1 fibroblasts transduced with the indicated virus were immunoblotted with antibodies raised against Sp1 and protein-disulfide isomerase (PDI). Densitometric analysis of immunoblots is shown below the immunoblot. Values represent means of three separate independent experiments. Luciferase activity was measured and normalized to cellular protein in 3T3-L1 preadipocytes (B) and adipocytes (C). D, 3T3-L1 preadipocytes stably expressing the pGL3 basic vector without (pGL3 basic) or with the Pemt promoter section −471 to +130 bp (−471 luciferase) upstream of the luciferase reporter gene were transduced with retrovirus generated from either pSuper.retro. containing scrambled (Scrambled RNAi) or Sp1 (Sp1 RNAi) short hairpin RNA sequences. Luciferase activity was measured in preadipocytes (E) and adipocytes (F) and normalized to cellular protein. Values are means ± S.E. of three independent experiments (*, p < 0.05).
FIGURE 9.
FIGURE 9.
Analysis of Sp1, PEMT, and TBP protein levels by immunoblotting. 3T3-L1 fibroblasts were differentiated into adipocytes. Day 0 represents 2 days at post-confluence and the starting point of the differentiation protocol. Cells were harvested at the indicted times (top row of numbers). 3T3-L1 homogenates (50 μg of protein) were separated on 0.4% SDS, 10% polyacrylamide gels, electroblotted on to polyvinylidene fluoride membranes, and probed with antibodies raised against Sp1, PEMT, or TATA-binding protein (TBP). The results are representative of three independent experiments. The numbers below each gel represent the mean of densitometric analysis of three immunoblots relative to the amount of TBP detected. HeLa whole cell lysate (50 μg, Santa Cruz Biotechnology) was used as a positive control for the indicated nuclear proteins.
FIGURE 10.
FIGURE 10.
Tamoxifen inhibits PEMT expression by increasing Sp1 binding. A, total RNA was extracted from the liver of adult male PEMT wild type mice injected subcutaneously with either tamoxifen (0.5 mg/kg/day in sesame oil, 1% benzyl alcohol) or vehicle for 5 consecutive days. The RNA was reverse-transcribed to cDNA, and Pemt mRNA levels were detected by quantitative PCR. mRNA levels were normalized to cyclophilin using a standard curve. Data represents means ± S.E. (*, p < 0.05, n = 5–7 mice). B, 3T3-L1 stably expressing −471 luciferase (Luc) were differentiated to adipocytes and treated with the indicated concentration of tamoxifen (in 1% dimethyl sulfoxide) or vehicle in 10% FBS, DMEM for 7 days. Luciferase activity was normalized to cellular protein. Values are means ± S.E. of three independent experiments (*, p < 0.05). C, 3T3-L1 adipocytes were incubated with vehicle (V) or tamoxifen (T, 10 μm) for 7 days or mithramycin (M, 10 μm) for 24 h. Cells were then washed twice with phosphate-buffered saline. Nuclear extract was obtained and incubated with 32Pi-labeled Pemt promoter (−441/−402). DNA-protein complexes (a–c) were separated on an 8% polyacrylamide gel. A 100-fold molar excess of unlabeled DNA oligonucleotide containing the Sp family consensus sequence was added to the binding reaction as indicated. D, densitometric analysis of results of three independent EMSA experiments are shown as a ratio of intensity of complex a (Sp1) to the intensity of complex c (YY1) (*, p < 0.05). E, in vivo association of Sp1 with the Pemt promoter. Protein-DNA complexes were immunoprecipitated from lysates of 3T3-L1 adipocytes treated with vehicle (V) or tamoxifen (T, 10 μm) for 7 days using antibodies (AB) to IgG or Sp1. The Pemt promoter was detected by PCR. DNA purified from sonicated lysates was used as a positive control (input). F, results of densitometric analysis of band from three independent experiments using Sp1 antibody and are means ± S.E. (*, p < 0.05).
FIGURE 11.
FIGURE 11.
Tamoxifen requires the Sp1-binding site to inhibit Pemt gene expression. A, −441/−402 section of the mouse promoter containing the wild type GC element (Wt) or the mutated GC element (MSp1) was 32Pi-labeled and incubated without (−) or with nuclear extract (NE) from mouse liver (+). Resulting DNA-protein complexes (a–c) were separated using an 8% polyacrylamide gel and visualized by autoradiography. The results are representative of three independent experiments. B, 3T3-L1 adipocytes stably expressing −471 luciferase (Luc) or −471MSp1 luciferase (containing a mutation in the Sp1-binding site) were differentiated to adipocytes and treated with 10 μm tamoxifen (in 1% dimethyl sulfoxide) or vehicle in 10% FBS, DMEM for 7 days. Luciferase activity was normalized to cellular protein. Values are means ± S.E. of three independent experiments (*, p < 0.05 compared with 3T3-L1 adipocytes stably expressing −471 luciferase treated with vehicle; #, p < 0.05, compared with 3T3-L1 adipocytes stably expressing −471 luciferase treated with vehicle or tamoxifen, analysis of variance).

Similar articles

Cited by

References

    1. Vance D. E., Vance J. E. (eds) (2008) Biochemistry of Lipids, Lipoproteins and Membranes, 5th Ed., pp. 214–244, Elsevier B. V., San Diego, CA
    1. Vance D. E., Ridgway N. D. (1988) Prog. Lipid Res. 27, 61–79 - PubMed
    1. Bremer J., Greenberg D. M. (1960) Biochim. Biophys. Acta 37, 173–175 - PubMed
    1. Cui Z., Vance J. E., Chen M. H., Voelker D. R., Vance D. E. (1993) J. Biol. Chem. 268, 16655–16663 - PubMed
    1. Shields D. J., Lehner R., Agellon L. B., Vance D. E. (2003) J. Biol. Chem. 278, 2956–2962 - PubMed

Publication types

MeSH terms