. 2010 Apr 7;29(7):1285-98.
doi: 10.1038/emboj.2010.10. Epub 2010 Feb 11.

Tonic ubiquitylation controls T-cell receptor:CD3 complex expression during T-cell development

Affiliations

Tonic ubiquitylation controls T-cell receptor:CD3 complex expression during T-cell development

Haopeng Wang et al. EMBO J. .

Abstract

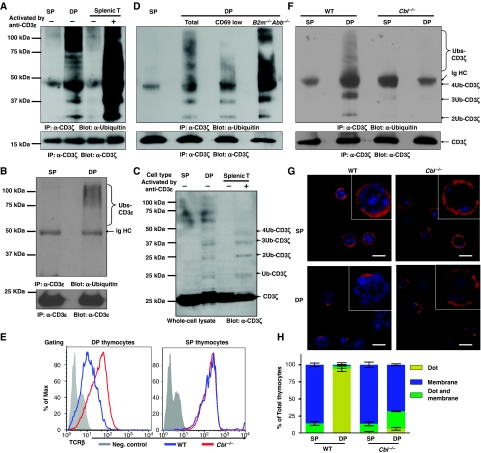
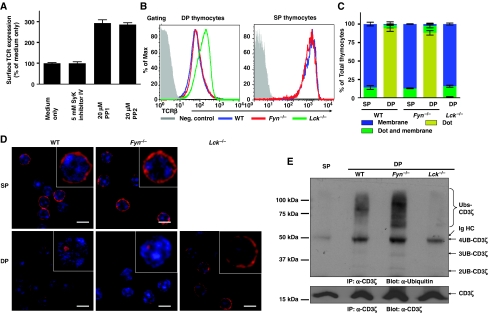
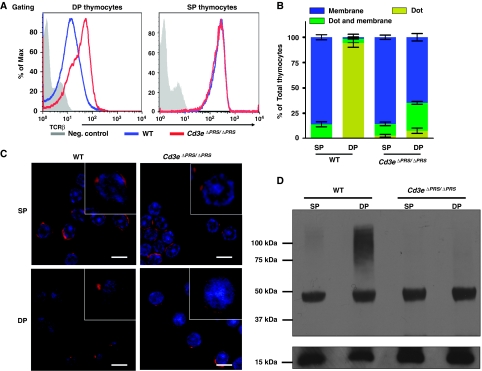
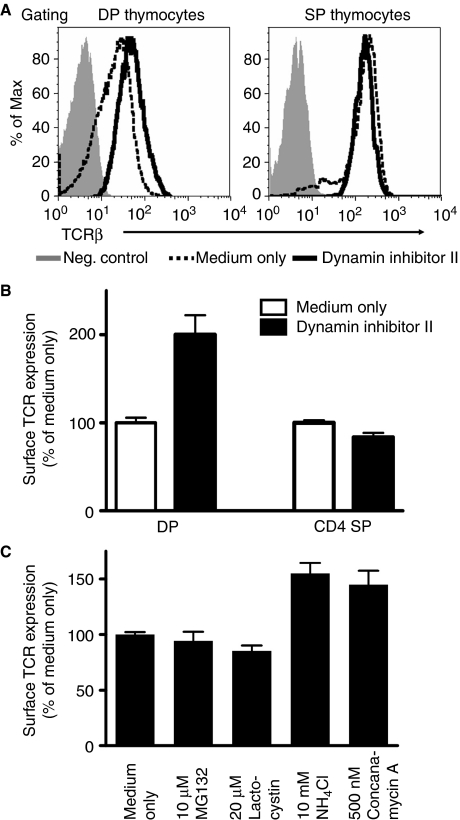
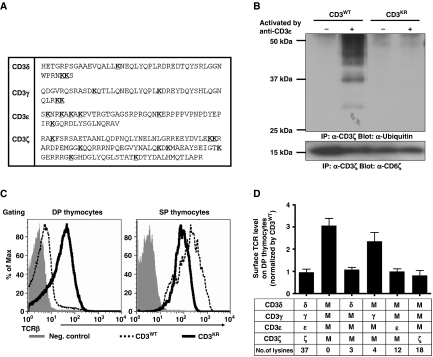
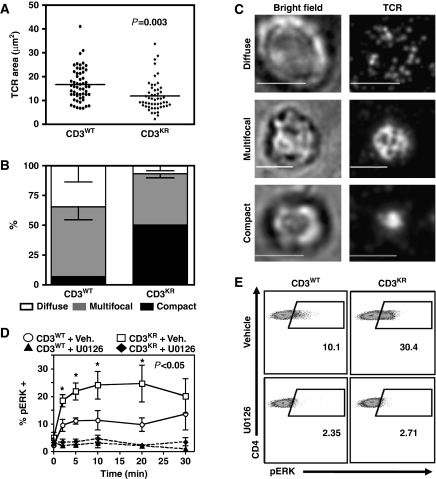
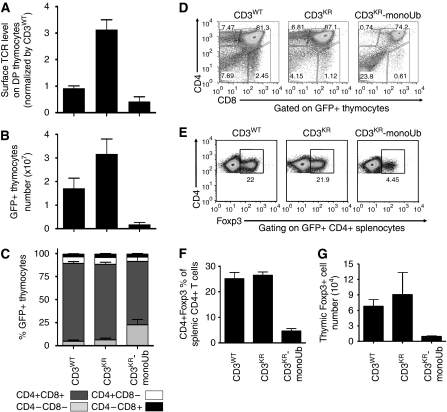
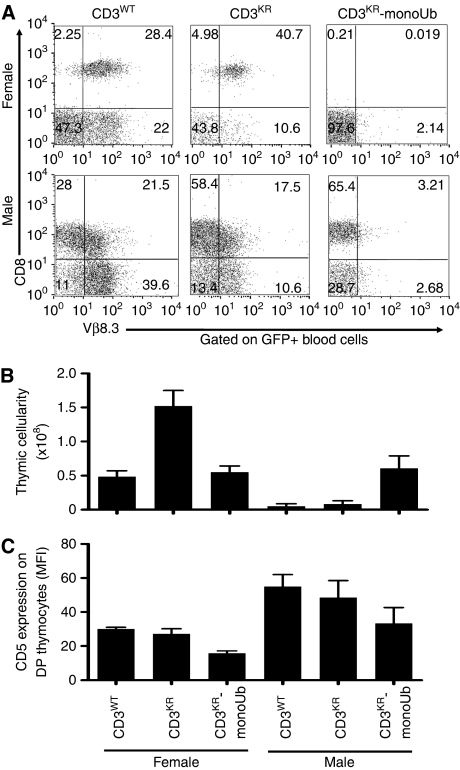
Expression of the T-cell receptor (TCR):CD3 complex is tightly regulated during T-cell development. The mechanism and physiological role of this regulation are unclear. Here, we show that the TCR:CD3 complex is constitutively ubiquitylated in immature double positive (DP) thymocytes, but not mature single positive (SP) thymocytes or splenic T cells. This steady state, tonic CD3 monoubiquitylation is mediated by the CD3varepsilon proline-rich sequence, Lck, c-Cbl, and SLAP, which collectively trigger the dynamin-dependent downmodulation, lysosomal sequestration and degradation of surface TCR:CD3 complexes. Blocking this tonic ubiquitylation by mutating all the lysines in the CD3 cytoplasmic tails significantly upregulates TCR levels on DP thymocytes. Mimicking monoubiquitylation by expression of a CD3zeta-monoubiquitin (monoUb) fusion molecule significantly reduces TCR levels on immature thymocytes. Moreover, modulating CD3 ubiquitylation alters immunological synapse (IS) formation and Erk phosphorylation, thereby shifting the signalling threshold for positive and negative selection, and regulatory T-cell development. Thus, tonic TCR:CD3 ubiquitylation results in precise regulation of TCR expression on immature T cells, which is required to maintain the fidelity of T-cell development.


Conflict of interest statement

The authors declare that they have no conflict of interest.

Figures

Figure 1
Figure 1
c-Cbl-mediated tonic ubiquitylation of CD3 on immature T cells. (AD, F) DP and SP thymocytes were purified by FACS, and splenic T cells purified by MACS. Splenic T cells were either resting or activated by crosslinking CD3ɛ for 2 min. (A) SP thymocytes (3 × 10⁷), DP thymocytes (24 × 107), and resting or activated splenic T cells (3 × 10⁷) were lysed in 1 ml lysis buffer. The lysates were immunoprecipitated with CD3ɛ antisera (551ζ), separated by SDS–PAGE and western blots was probed with Ub mAb (P4D1). Blots were stripped and reprobed with CD3ζ mAb (H146) to show that an equal amount of CD3ζ was analysed in each sample. (B) After immunoprecipitation with CD3ζ mAb as described in (A), the lysates were further immunoprecipitated with CD3ɛ mAb (2C11), separated by SDS–PAGE and western blots was probed with Ub mAb. Blots were stripped and reprobed with CD3ɛ mAb (HTM3.1). (C) Lysates (20 μl) were separated by SDS–PAGE and immunoblotted with CD3ζ mAb. (D, F) Analysis was performed as in (A), except that wild-type CD69low and B2m−/−Abb−/− [MHC class I and class II deficient] DP thymocytes (D), or c-Cbl−/− SP and DP thymocytes (F) were purified by FACS and included in the analysis. (E) DP and SP thymocytes were purified from either C57BL/6J mice or c-Cbl−/− mice, and TCRβ surface expression was measured by flow cytometry. (G, H) Thymocytes were stained with mAbs against CD4 and CD8, and DP and SP thymocytes purified by FACS. Sorted thymocytes were fixed, permeabilized, and stained with Alexa-647-conjugated CD3ζ mAb. The localization of CD3ζ (red) and DAPI-stained nucleus (blue) are shown in representative confocal images (G). The distribution of CD3ζ in thymocyte populations is indicated (n>50) (H).
Figure 2
Figure 2
Lck is required for tonic ubiquitylation of CD3 in DP thymocytes. (A) Thymic lobes from newborn mice (P1) were treated with the inhibitors indicated for 20 h, and surface TCRβ expression determined by flow cytometry. Data represent the mean±s.e.m. of 5–10 mice from 2–3 experiments per group. (B) Thymi were isolated from WT, Fyn−/−, or Lck−/− mice. Surface expression of the TCR:CD3 complex was measured by flow cytometry on thymocytes co-stained with mAbs against CD4, CD8, and TCRβ. (C, D) Thymocytes were stained with mAbs against CD4 and CD8, and DP and SP thymocytes purified by FACS. Sorted thymocytes were fixed, permeabilized, and stained with Alexa-647-conjugated CD3ζ mAb. The distribution of CD3ζ in thymocyte populations is indicated (n>50) (C). The localization of CD3ζ (red) and DAPI stained nucleus (blue) are shown in representative confocal images (D). (E) Tonic ubiquitylation of CD3 was performed with WT, Fyn−/−, or Lck−/− mice as described in Figure 1A.
Figure 3
Figure 3
CD3ɛ-PRS mediates CD3 tonic ubiquitylation in DP thymocytes. (A) Thymi were isolated from WT or CD3eΔPRS/ΔPRS mice. Surface expression of the TCR:CD3 complex was measured by flow cytometry on thymocytes co-stained with mAbs against CD4, CD8, and TCRβ. (B, C) Thymocytes were stained with anti-CD4 and anti-CD8, and DP and SP thymocytes were purified by FACS. Sorted thymocytes were fixed, permeabilized, and stained with Alexa-647-conjugated CD3ζ mAb. The distribution of CD3ζ in thymocyte populations is indicated (n>50) (B). The localization of CD3ζ (red) and DAPI-stained nucleus (blue) are shown in representative confocal images (C). (D) Tonic ubiquitylation of CD3 was performed as described in Figure 1A.
Figure 4
Figure 4
Monoubiquitylation induces dynamin-mediated internalization of the TCR:CD3 complex followed by lysosomal degradation. Thymic lobes from neonatal mice (P1) were treated with the inhibitors indicated for 20 h, and surface TCRβ expression determined by flow cytometry. Data represent the mean±s.e.m. of 5–8 mice from 2 to 3 experiments per group (A, B) or 5–10 mice from 2 to 3 experiments per group (C). A full-colour version of this figure is available at The EMBO Journal Online.
Figure 5
Figure 5
Regulation of TCR surface expression by CD3 tonic ubiquitylation. (A) The amino-acid sequence of the CD3 cytoplasmic domains highlighting the 37 lysine residues (bold and underlined). (B) Retrogenic mice were generated by transducing CD3ɛζ−/− bone marrow with CD3WT or CD3KR constructs as indicated, transplanting into sublethally irradiated Rag1−/− recipients and analysing 5–8 weeks after transfer. Splenic T cells were purified by MACS from either CD3WT or CD3KR retrogenic mice and activated by CD3ɛ mAb. Lysates were immunoprecipitated with CD3ζ mAb, separated by SDS–PAGE, and western blots were probed with ubiquitin mAb as in Figure 1A. The membrane was stripped and re-probed with CD3ζ mAb to show comparable CD3ζ loading. (C) Representative flow cytometry histograms are presented showing surface TCRβ expression on DP and SP thymocytes from CD3WT and CD3KR retrogenic mice (representative of 10–20 mice from more than three experiments). (D) Surface TCRβ expression on DP thymocytes of CD3WT or various CD3KR retrogenic mice, determined by flow cytometry. The difference between CD3WT and CD3δɛζKRγWT is statistically significant (P=0.008). Data represent the mean±s.e.m. of 5–20 mice from more than two experiments. A full-colour version of this figure is available at The EMBO Journal Online.
Figure 6
Figure 6
Impaired CD3 ubiquitylation enhances IS formation and increases ERK phosphorylation in DP thymocytes. (AC) DP thymocytes from CD3WT or CD3KR Rg mice were purified by FACS and added to a synthetic planar lipid bilayer containing unlabelled His-tagged ICAM-1 and fluorescently labelled streptavidin conjugated to biotinylated anti-TCRβ antibodies. Interactions were fixed following 15 min stimulation, visualized using spinning disk confocal microscopy and analysed using Slidebook software. (A) The area of individual DP T-cell synapses obtained in two independent experiments. (B, C) The morphology of individual synapses were classified according to the representative images (B) and shown graphically (C—Scale bar=5 mm). (D, E) Thymocytes from CD3WT or CD3KR Rg mice were isolated, rested in 0.5% FCS RPMI for 1 h at 37°C, and then activated by crosslinking using a CD3ɛ mAb in the presence (+U0126) or absence (+Veh.) of the MEK inhibitor U0126. Thymocytes were then fixed at the indicated time, permeablized, and stained with CD4, CD8, and pERK Abs. (D) CD4+CD8+ DP thymocytes were gated and pERK expression measured. (E) Representative flow cytometry dot plots are shown 10 min after stimulation. Statistical significance was determined using an unpaired t test in Prism software.
Figure 7
Figure 7
CD3 ubiquitylation alters TCR expression, thymic cellularity, and Treg development. Retrogenic mice were generated by reconstituting sublethally irradiated Rag1−/− recipients with transduced CD3ɛζ−/− bone marrow. Mice were analysed 5–8 weeks after transfer. Thymocytes were counted and stained with antibodies to CD4, CD8, and TCRβ, and analysed by flow cytometry. Surface TCR level on GFP+ DP thymocytes (A), GFP+ thymocyte number (B), and the percentage of GFP+ thymocytes (C) was determined. Data were gated on live, GFP+ cells, and represent the mean±s.e.m. of 10–20 mice from more than three experiments per group. (D) Representative dot plots of GFP+ thymocytes stained with antibodies to CD4 and CD8 are shown (representative of 10–20 mice from more than three experiments). (EG) Splenocytes and thymocytes were surface stained with CD4 mAb and intracellularly stained with Foxp3 mAb. Representative dot plots of CD4+ splenic T cells from a retrogenic mouse experiment are shown (E). Bar charts show the percentage of splenic CD4+ T-cells expressing Foxp3 (F) and the number of Foxp3+ thymocytes (G). A full-colour version of this figure is available at The EMBO Journal Online.
Figure 8
Figure 8
TCR:CD3 ubiquitylation modulates T-cell development. (AC) Bone marrow from female or male CD3ζɛ−/−Rag1−/− mice was co-transduced with the MataHari TCRαβ and CD3WT, CD3KR, or CD3KR-monoUb. Transduced bone marrow was used to reconstitute irradiated, sex-matched Rag1−/− mice. Mice were bled and killed 6–8 weeks after transfer. Peripheral blood was stained with antibodies to CD8 and Vβ8.3 (A). Bar charts show the number of thymocytes (B) and CD5 expression on DP thymocytes (C) in each group. Data are gated on GFP+ cells and are represent the mean±s.e.m. of 5–10 mice from two experiments per group. A full-colour version of this figure is available at The EMBO Journal Online.

Similar articles

Cited by

References

    1. Aguado E, Richelme S, Nunez-Cruz S, Miazek A, Mura AM, Richelme M, Guo XJ, Sainty D, He HT, Malissen B, Malissen M (2002) Induction of T helper type 2 immunity by a point mutation in the LAT adaptor. Science 296: 2036–2040 - PubMed
    1. Aivazian D, Stern LJ (2000) Phosphorylation of T cell receptor zeta is regulated by a lipid dependent folding transition. Nat Struct Biol 7: 1023–1026 - PubMed
    1. Bluestone JA, Pardoll D, Sharrow SO, Fowlkes BJ (1987) Characterization of murine thymocytes with CD3-associated T-cell receptor structures. Nature 326: 82–84 - PubMed
    1. Brodeur JF, Li S, Martins MS, Larose L, Dave VP (2009) Critical and multiple roles for the CD3epsilon intracytoplasmic tail in double negative to double positive thymocyte differentiation. J Immunol 182: 4844–4853 - PubMed
    1. Cadwell K, Coscoy L (2005) Ubiquitination on nonlysine residues by a viral E3 ubiquitin ligase. Science 309: 127–130 - PubMed

Publication types

MeSH terms

Substances