

In Vitro Electrochemistry of Biological Systems
- PMID: 20151038
- PMCID: PMC2819529
- DOI: 10.1146/annurev.anchem.1.031207.113038
In Vitro Electrochemistry of Biological Systems
Abstract
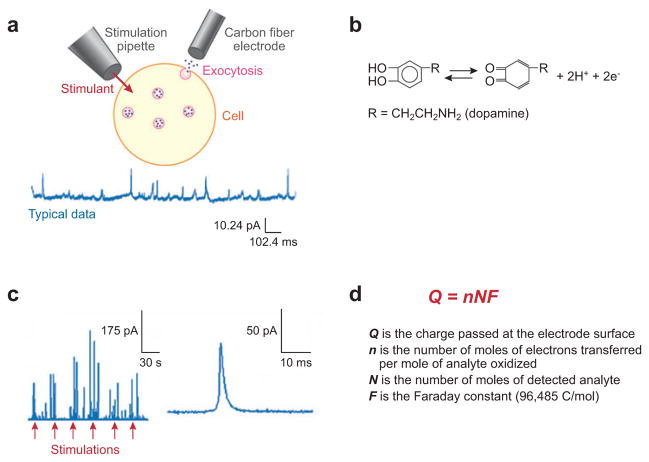
This article reviews recent work involving electrochemical methods for in vitro analysis of biomolecules, with an emphasis on detection and manipulation at and of single cells and cultures of cells. The techniques discussed include constant potential amperometry, chronoamperometry, cellular electroporation, scanning electrochemical microscopy, and microfluidic platforms integrated with electrochemical detection. The principles of these methods are briefly described, followed in most cases with a short description of an analytical or biological application and its significance. The use of electrochemical methods to examine specific mechanistic issues in exocytosis is highlighted, as a great deal of recent work has been devoted to this application.
Figures
Similar articles
-
Monitoring of vesicular exocytosis from single cells using micrometer and nanometer-sized electrochemical sensors.Anal Bioanal Chem. 2009 May;394(1):17-32. doi: 10.1007/s00216-009-2703-2. Epub 2009 Mar 10. Anal Bioanal Chem. 2009. PMID: 19274456 Review.
-
Biomarker detection for disease diagnosis using cost-effective microfluidic platforms.Analyst. 2015 Nov 7;140(21):7062-81. doi: 10.1039/c5an00780a. Analyst. 2015. PMID: 26171467 Free PMC article. Review.
-
Vesicular exocytosis and microdevices - microelectrode arrays.Analyst. 2015 Jun 7;140(11):3687-95. doi: 10.1039/c4an01932f. Analyst. 2015. PMID: 25803190 Review.
-
Molecular Imprinting Technology for Determination of Uric Acid.Int J Mol Sci. 2021 May 10;22(9):5032. doi: 10.3390/ijms22095032. Int J Mol Sci. 2021. PMID: 34068596 Free PMC article. Review.
-
Quantitative measurements of released amines from individual exocytosis events.Mol Neurobiol. 1997 Aug;15(1):1-16. doi: 10.1007/BF02740612. Mol Neurobiol. 1997. PMID: 9396001 Review.
Cited by
-
Carbon-ring microelectrode arrays for electrochemical imaging of single cell exocytosis: fabrication and characterization.Anal Chem. 2012 Mar 20;84(6):2949-54. doi: 10.1021/ac3000368. Epub 2012 Mar 6. Anal Chem. 2012. PMID: 22339586 Free PMC article.
-
Nanoparticle-Templated Molecular Recognition Platforms for Detection of Biological Analytes.Curr Protoc Chem Biol. 2016 Sep 13;8(3):197-223. doi: 10.1002/cpch.10. Curr Protoc Chem Biol. 2016. PMID: 27622569 Free PMC article.
-
New trends in the electrochemical sensing of dopamine.Anal Bioanal Chem. 2013 Apr;405(11):3753-71. doi: 10.1007/s00216-012-6578-2. Epub 2012 Dec 16. Anal Bioanal Chem. 2013. PMID: 23241816 Free PMC article. Review.
-
Characterization of Membrane Patch-Ion Channel Probes for Scanning Ion Conductance Microscopy.Small. 2018 May;14(18):e1702945. doi: 10.1002/smll.201702945. Epub 2017 Dec 11. Small. 2018. PMID: 29226633 Free PMC article.
-
Amperometric post spike feet reveal most exocytosis is via extended kiss-and-run fusion.Sci Rep. 2012;2:907. doi: 10.1038/srep00907. Epub 2012 Nov 30. Sci Rep. 2012. PMID: 23205269 Free PMC article.
References
-
- Adams RN. Probing brain chemistry with electroanalytical techniques. Anal Chem. 1976;48:1126A–38A. - PubMed
-
- Leszczyszyn DJ, Jankowski JA, Viveros OH, Diliberto EJ, Jr, Near JA, Wightman RM. Nicotinic receptor-mediated catecholamine secretion from individual chromaffin cells: chemical evidence for exocytosis. J Biol Chem. 1990;265:14736–37. - PubMed
-
- Durack GR, Robinson JP, editors. Emerging Tools for Single-Cell Analysis: Advances in Optical Measurement Technologies Cytometric Cellular Analysis. New York: Wiley; 2000.
-
- Stamford JA, Justice JBJ. Probing brain chemistry. Anal Chem. 1996;68:359A–63A. - PubMed
Grants and funding
LinkOut - more resources
Full Text Sources
Other Literature Sources
