

Candesartan Differentially Regulates Epithelial Sodium Channel in Cortex Versus Medulla of Streptozotocin-Induced Diabetic Rats
- PMID: 20151042
- PMCID: PMC2819702
- DOI: 10.2174/1875044300902010023
Candesartan Differentially Regulates Epithelial Sodium Channel in Cortex Versus Medulla of Streptozotocin-Induced Diabetic Rats
Abstract
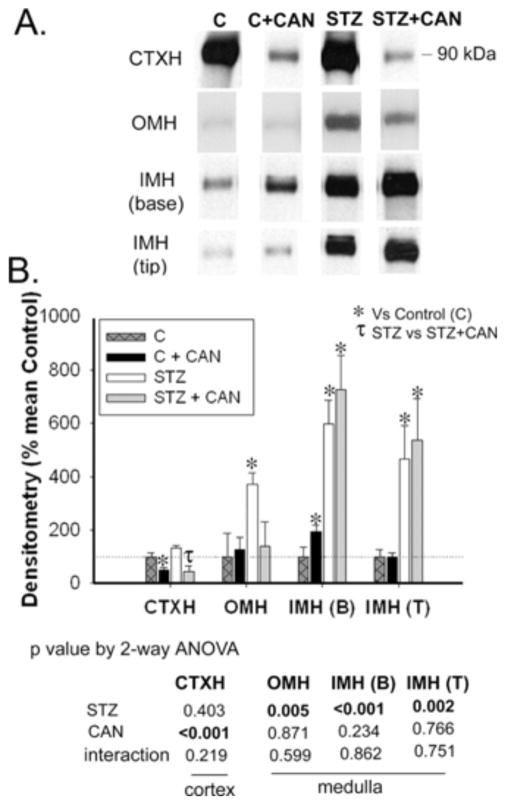
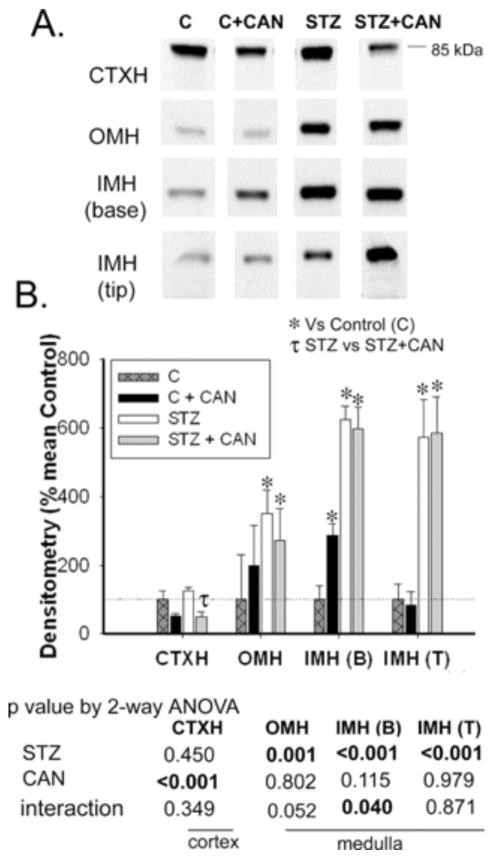
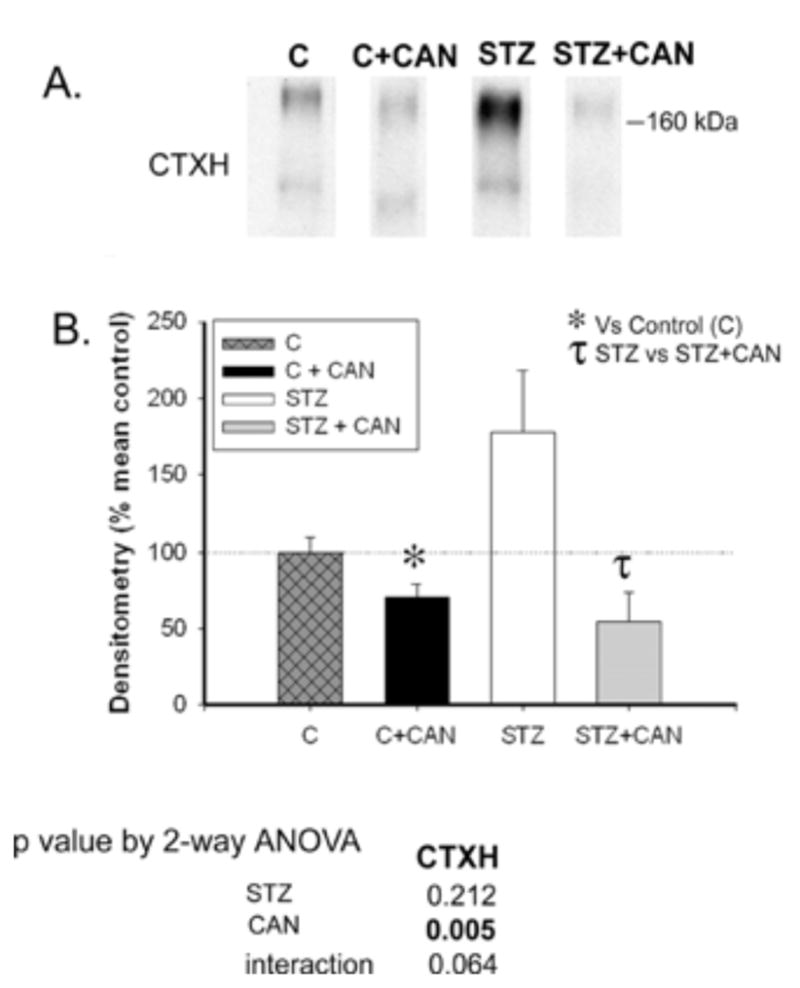
Diabetes is associated with an activated renal renin-angiotensin-aldosterone system (RAAS) and it was shown that streptozotocin (STZ)-induced diabetic rats had increased whole kidney protein levels of the epithelial sodium channel subunits (α-, β- and γ-ENaC). However, the role of the RAAS on the regional, i.e., cortical versus medullary, regulation of ENaC is unclear. Male Sprague-Dawley rats were injected with STZ (intravenous, 65 mg/kg·bw, n=12/group). After 14 days, half of them received drinking water with candesartan (2 mg/kg·bw/day), an angiotensin-II type-1 receptor (AT1R) antagonist, for one week. In the medulla, i.e., inner stripe of the outer medulla (ISOM), base and/or tip of the inner medulla, immunoblotting revealed increased protein abundances of α1 Na-K-ATPase and ENaC subunits with diabetes (200-600% of controls), which were not reversed by candesartan. In fact, candesartan increased all ENaC subunits and α1 Na-K-ATPase in the ISOM and/or base in control rats. In contrast, in the cortex, diabetes did not increase these proteins. However, candesartan reduced cortical β- and γ-ENaC regardless of diabetic state. In summary, diabetes-induced increases in ENaC were seen preferentially in the medulla. These changes appeared to be due to a mechanism clearly distinct from AT1R activation, because they were not abolished by candesartan. In fact, candesartan treatment tended to increase some of these medullary proteins, perhaps in compensation for increased NaCl load. In contrast, cortical β- and γ-ENaC were reduced by candesartan regardless of diabetic state suggesting their regulation by AT1R at this site; however this did not appear to be a site of diabetes-induced ENaC up-regulation.
Figures


Similar articles
-
Increased apical targeting of renal ENaC subunits and decreased expression of 11betaHSD2 in HgCl2-induced nephrotic syndrome in rats.Am J Physiol Renal Physiol. 2006 Mar;290(3):F674-87. doi: 10.1152/ajprenal.00084.2005. Epub 2005 Sep 27. Am J Physiol Renal Physiol. 2006. PMID: 16189294
-
Increased expression and apical targeting of renal ENaC subunits in puromycin aminonucleoside-induced nephrotic syndrome in rats.Am J Physiol Renal Physiol. 2004 May;286(5):F922-35. doi: 10.1152/ajprenal.00277.2003. Epub 2004 Jan 6. Am J Physiol Renal Physiol. 2004. PMID: 15075188
-
Long-term regulation of ENaC expression in kidney by angiotensin II.Hypertension. 2003 May;41(5):1143-50. doi: 10.1161/01.HYP.0000066129.12106.E2. Epub 2003 Apr 7. Hypertension. 2003. PMID: 12682079
-
Changes of renal AQP2, ENaC, and NHE3 in experimentally induced heart failure: response to angiotensin II AT1 receptor blockade.Am J Physiol Renal Physiol. 2009 Dec;297(6):F1678-88. doi: 10.1152/ajprenal.00010.2009. Epub 2009 Sep 23. Am J Physiol Renal Physiol. 2009. PMID: 19776175 Free PMC article.
-
Increased expression of ENaC subunits and increased apical targeting of AQP2 in the kidneys of spontaneously hypertensive rats.Am J Physiol Renal Physiol. 2005 Nov;289(5):F957-68. doi: 10.1152/ajprenal.00413.2004. Epub 2005 Jun 14. Am J Physiol Renal Physiol. 2005. PMID: 15956775
Cited by
-
Diuretic Effects of Sodium Glucose Cotransporter 2 Inhibitors and Their Influence on the Renin-Angiotensin System.Int J Mol Sci. 2019 Feb 1;20(3):629. doi: 10.3390/ijms20030629. Int J Mol Sci. 2019. PMID: 30717173 Free PMC article. Review.
-
Urinary Exosomal microRNA-451-5p Is a Potential Early Biomarker of Diabetic Nephropathy in Rats.PLoS One. 2016 Apr 21;11(4):e0154055. doi: 10.1371/journal.pone.0154055. eCollection 2016. PLoS One. 2016. PMID: 27101382 Free PMC article.
-
NOX4-dependent regulation of ENaC in hypertension and diabetic kidney disease.FASEB J. 2020 Oct;34(10):13396-13408. doi: 10.1096/fj.202000966RR. Epub 2020 Aug 16. FASEB J. 2020. PMID: 32799394 Free PMC article.
-
Losartan prevents the elevation of blood pressure in adipose-PRR deficient female mice while elevated circulating sPRR activates the renin-angiotensin system.Am J Physiol Heart Circ Physiol. 2019 Mar 1;316(3):H506-H515. doi: 10.1152/ajpheart.00473.2018. Epub 2018 Dec 14. Am J Physiol Heart Circ Physiol. 2019. PMID: 30550352 Free PMC article.
-
Chronic vasodilation increases renal medullary PDE5A and α-ENaC through independent renin-angiotensin-aldosterone system pathways.Am J Physiol Regul Integr Comp Physiol. 2013 Nov 15;305(10):R1133-40. doi: 10.1152/ajpregu.00003.2013. Epub 2013 Sep 25. Am J Physiol Regul Integr Comp Physiol. 2013. PMID: 24068049 Free PMC article.
References
-
- Song J, Knepper MA, Verbalis JG, Ecelbarger CA. Increased renal ENaC subunit and sodium transporter abundances in streptozotocin-induced type 1 diabetes. Am J Physiol Renal Physiol. 2003;285(6):F1125–37. - PubMed
-
- Kim D, Sands JM, Klein JD. Changes in renal medullary transport proteins during uncontrolled diabetes mellitus in rats. Am J Physiol Renal Physiol. 2003;285(2):F303–F309. - PubMed
-
- Beutler KT, Masilamani S, Turban S, et al. Long-term regulation of ENaC expression in kidney by angiotensin II. Hypertension. 2003;41(5):1143–50. - PubMed
-
- Peti-Peterdi J, Warnock DG, Bell PD. Angiotensin II directly stimulates ENaC activity in the cortical collecting duct via AT(1) receptors. J Am Soc Nephrol. 2002;13(5):1131–5. - PubMed
Grants and funding
LinkOut - more resources
Full Text Sources